Journey as Destination
Live
Overview
- Role
- Researcher & Designer (thesis project)
- Period
- 2019 - 2020
What I did
- Conducted extensive research on pedestrian experience in urban environments
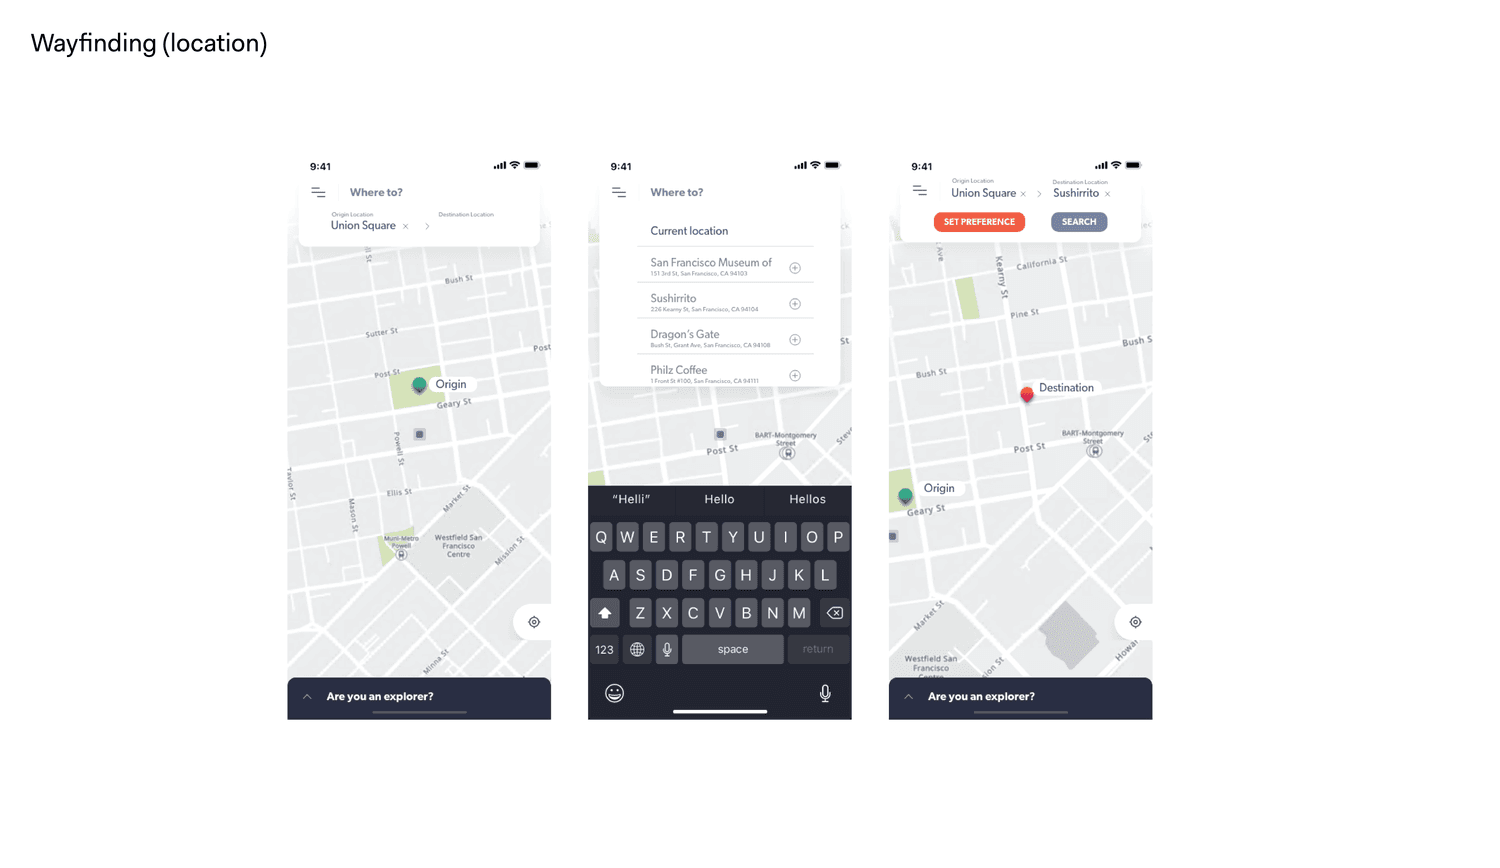
- Designed user flows for preference input and route visualization
- Created high-fidelity UI mockups and interactive prototypes
Problem
Standard navigation prioritizes efficiency, ignoring the qualitative journey experience (safety, greenery, etc.), creating a need for tools better aligned with pedestrian well-being and preferences.
What I designed & built
Based on extensive research, I designed and prototyped a mobile app concept demonstrating how experiential factors could enrich route planning. It allows users to choose routes that align with their preferences, offering a more human-centered navigation alternative.
Process
Discovery & Research
Initiated the process by exploring the problem space, understanding existing pedestrian behaviors, and grounding the work in relevant behavioral theory.
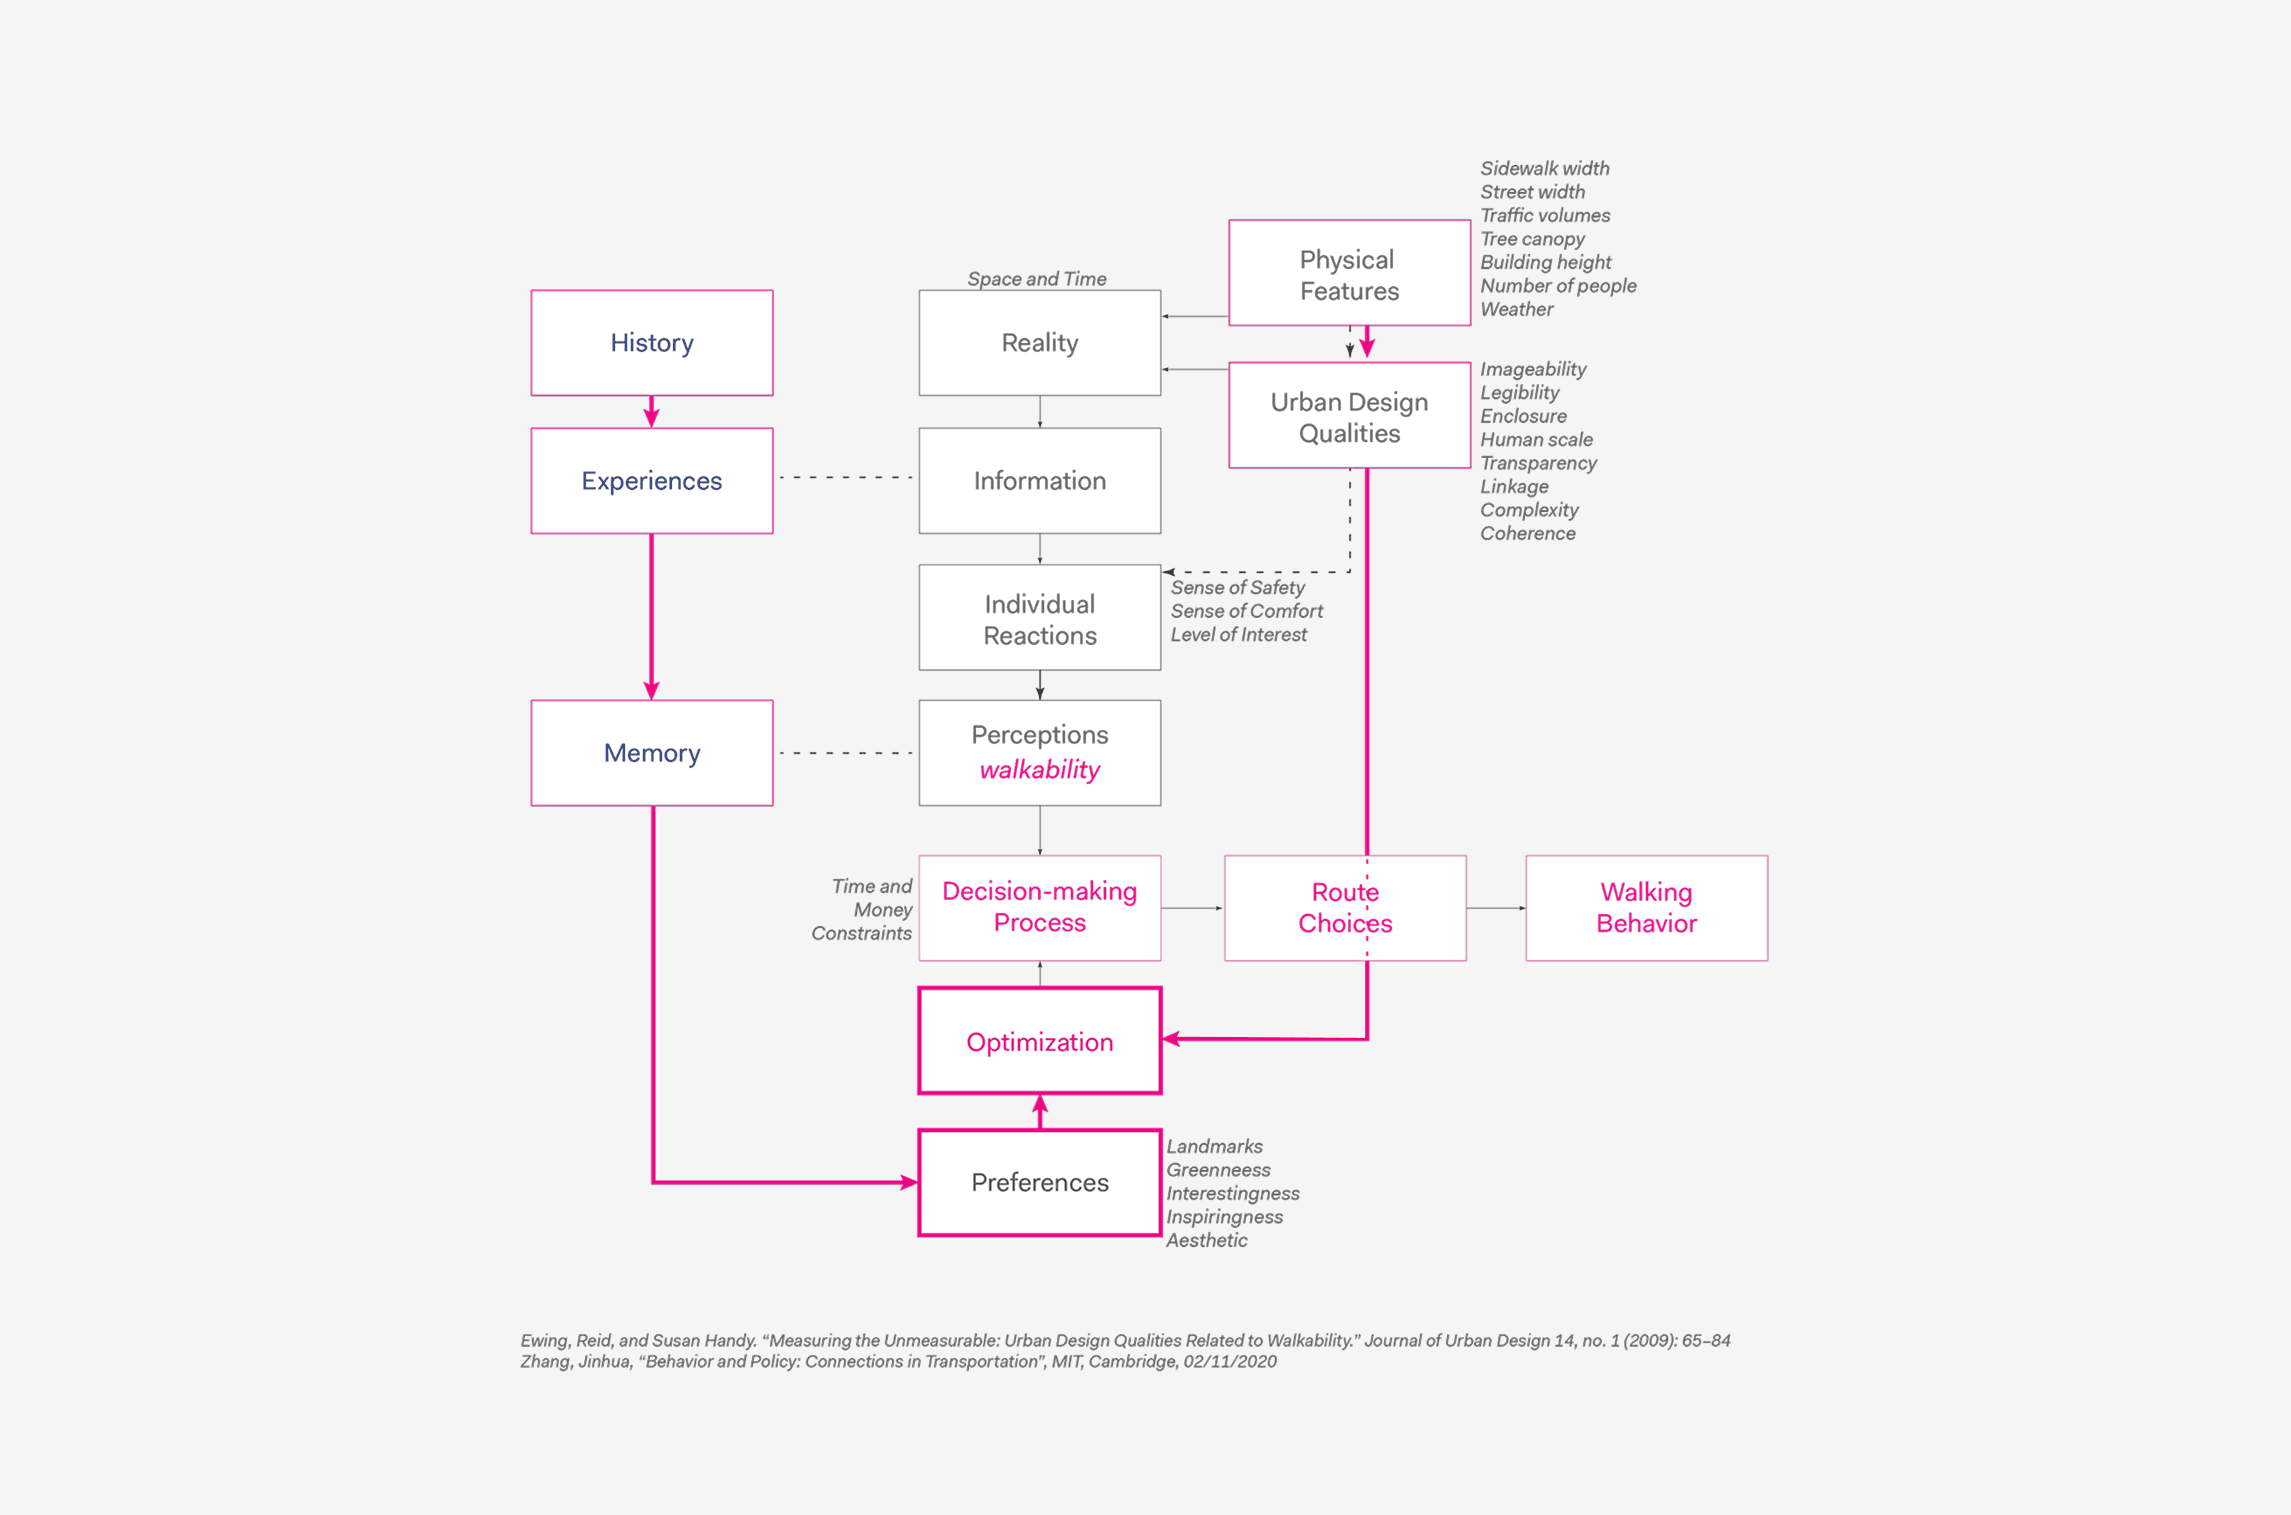
Theoretical Grounding: Bounded Rationality
We started with the Bounded Rationality theory, recognizing that individuals often make choices based on limited information and personal preferences rather than pure optimization. This supported exploring factors beyond just the shortest route.
Quantitative Insights: Detour Ratio Analysis
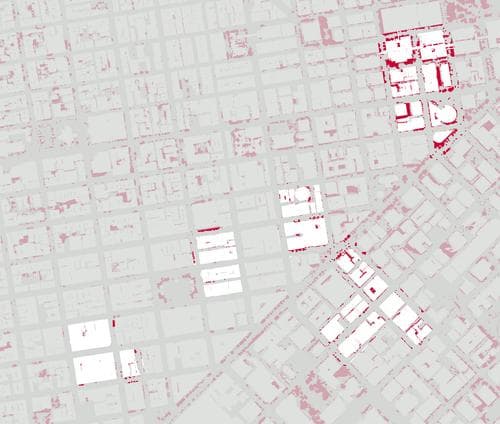
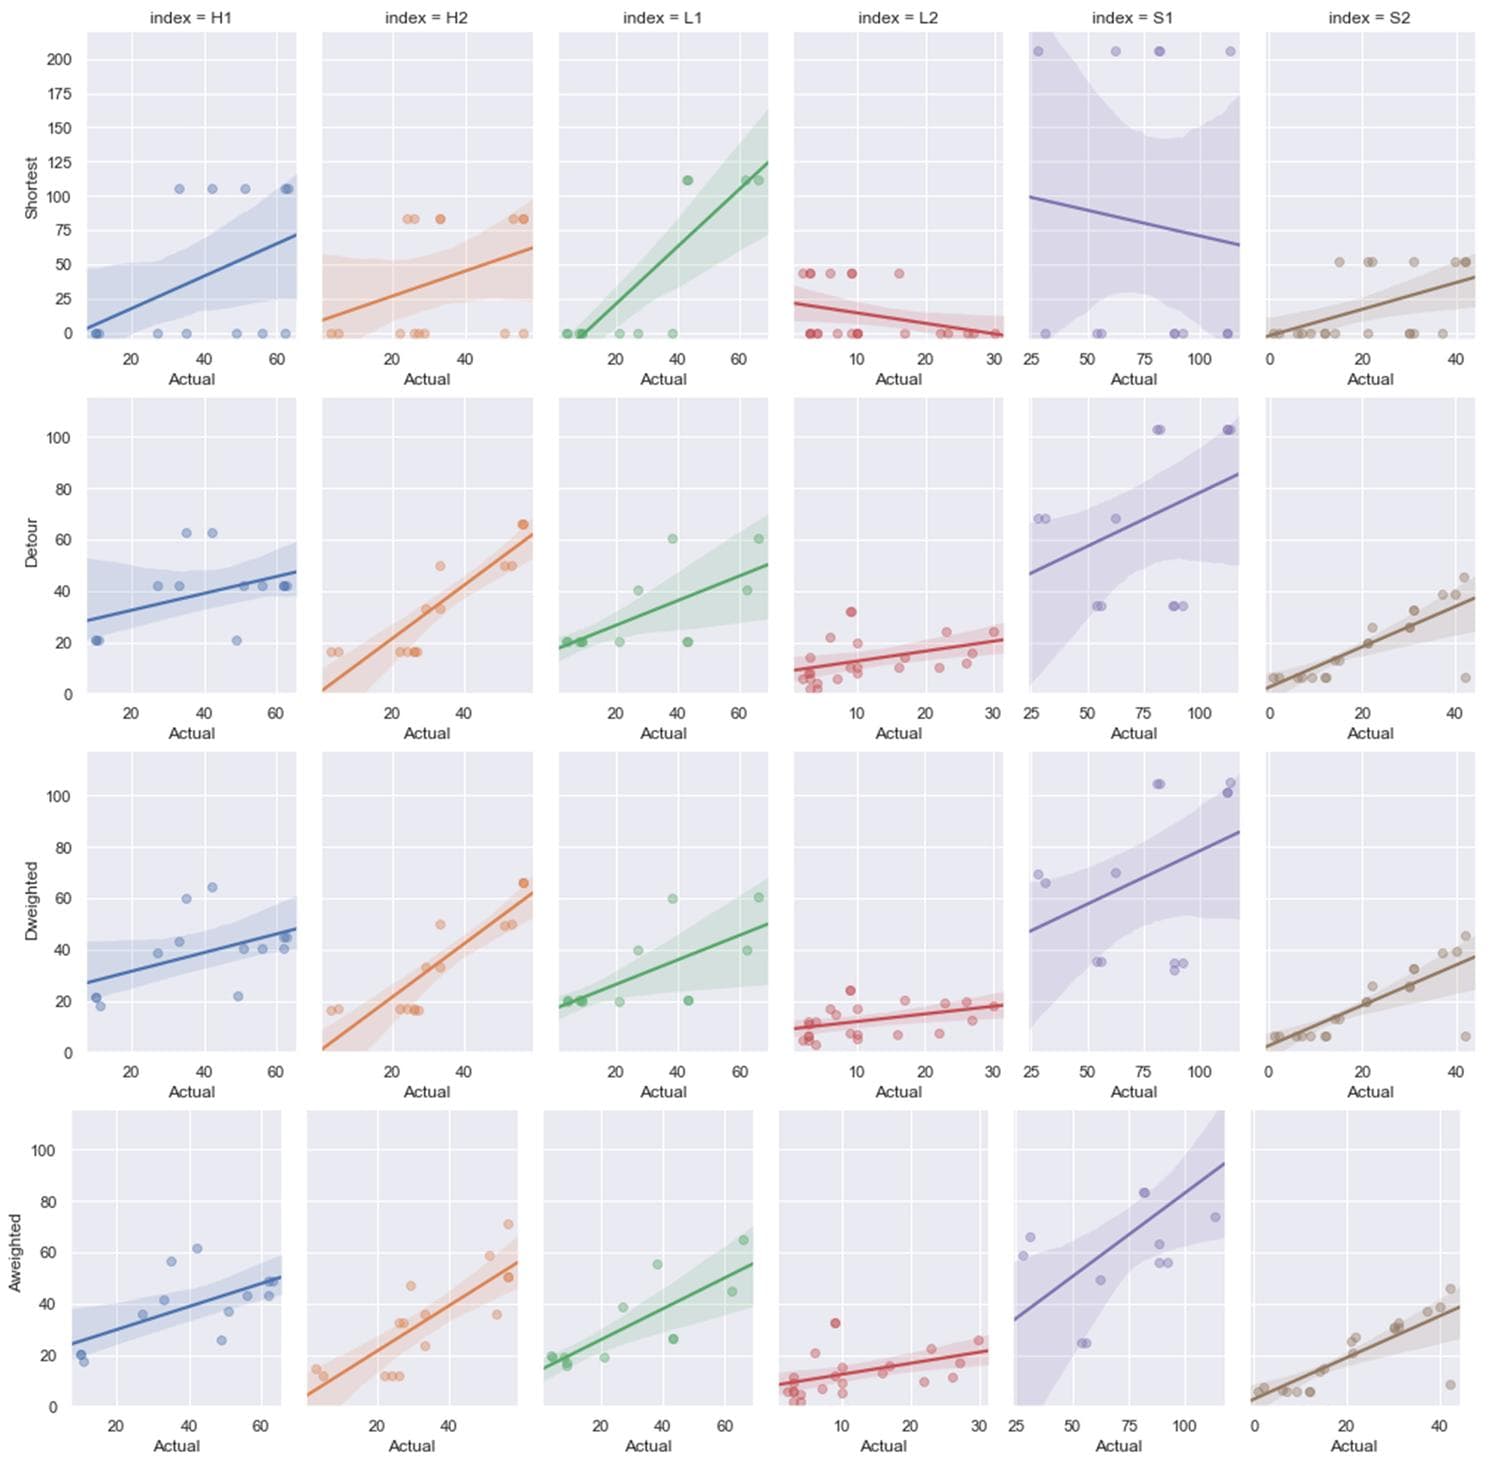
To understand current behavior, we analyzed a dataset of 22,636 pedestrian trajectories in San Francisco. Calculating the detour ratio revealed how often and how far people deviate from the shortest path.
Key Finding
Pedestrians frequently detour significantly, confirming they implicitly value factors beyond distance and are willing to walk farther for a potentially better experience.
How do we quantify and design for the subjective, experiential factors that influence pedestrian route choice beyond just efficiency?
- People already detour from optimal routes for subjective reasons
- Current navigation apps ignore qualitative journey factors
- Bounded rationality theory explains why people don't always choose shortest paths
- Environmental factors (safety, aesthetics) significantly impact route satisfaction
- Focus purely on efficiency optimization with minor tweaks
- Create separate app categories for different journey types
- Develop complex algorithm with weighted environmental factors
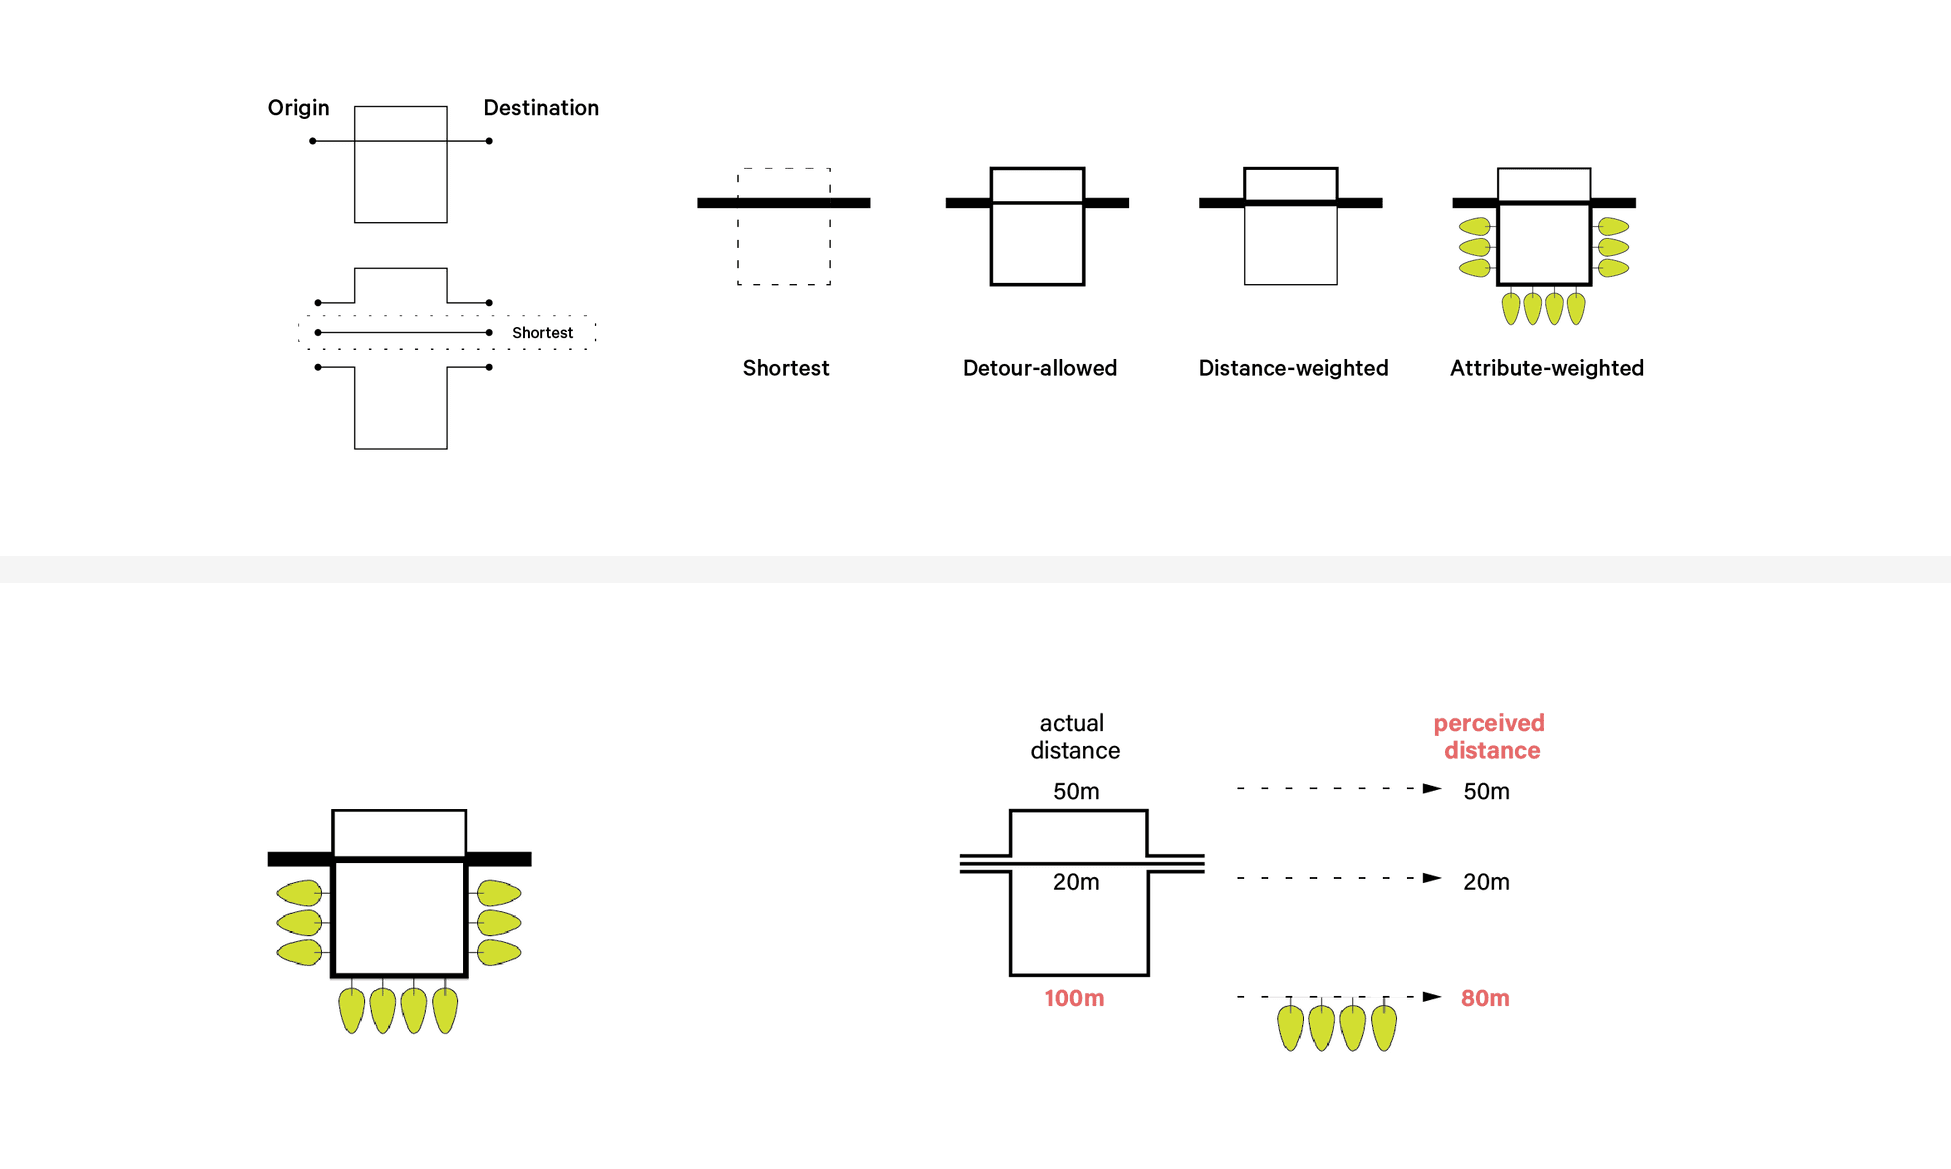
Chose to develop a 'Perceived Distance' model that weights actual distance by environmental factors, making subjective preferences quantifiable and actionable.
Analyzed 22,636 trajectories to validate that people do value experience over efficiency, this data-driven insight shaped the entire design direction.
Framework Development
Developed a conceptual framework for evaluating journey quality beyond time/distance, forming the foundation for the design.
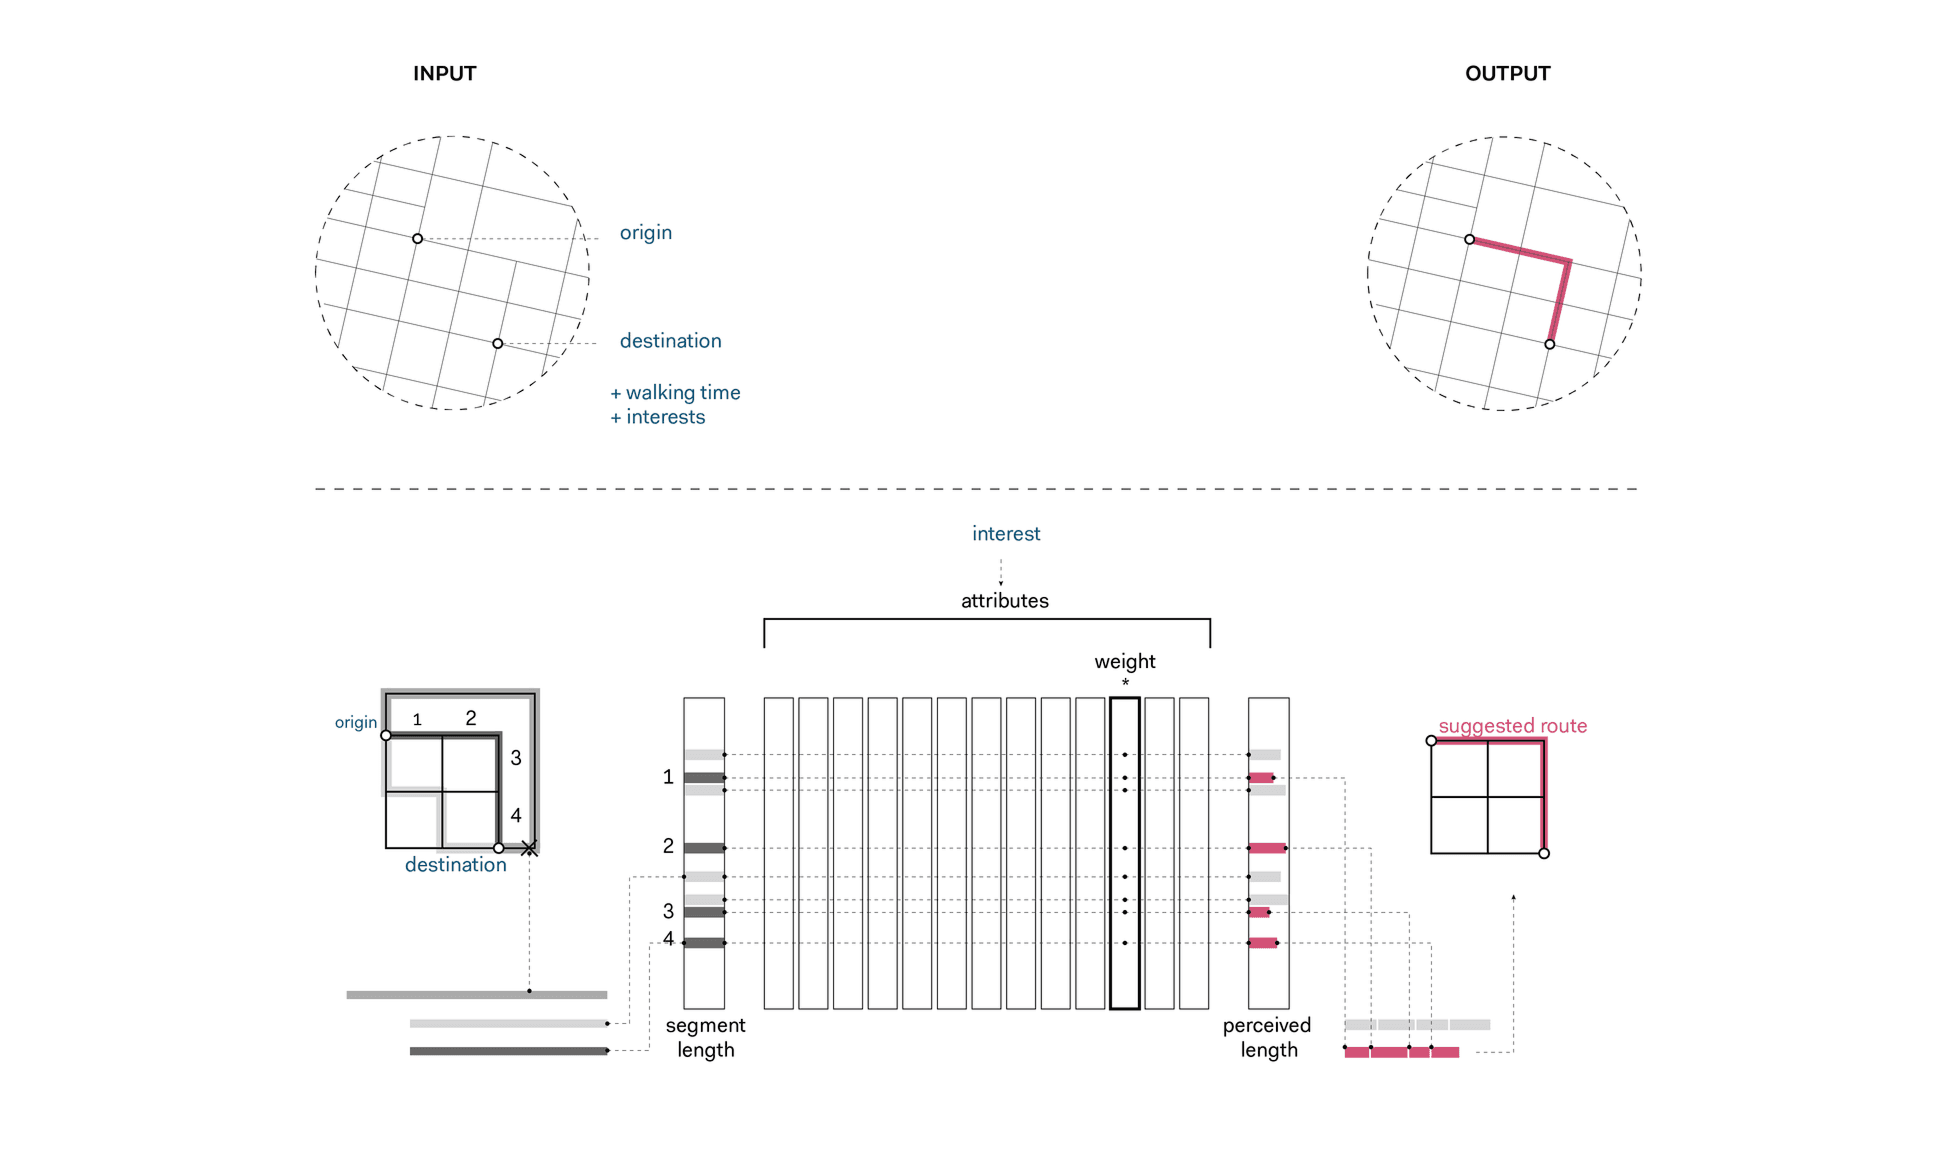
Qualitative Model: Perceived Distance
Based on the understanding that attributes matter, we explored models considering factors like tree coverage, amenities, and perceived safety. We developed the concept of 'Perceived Distance' – weighting actual distance by these attributes to quantify route attractiveness based on user preferences.
Key Finding
Route attractiveness can be modeled by considering street attributes, forming the core mechanism for personalized routing.
Conceptual Framework Development
A framework was outlined to structure the evaluation of journey quality. This involved defining key experiential factors (safety, nature, points of interest, etc.) and establishing how they would feed into the 'Perceived Distance' calculation.
How do we translate subjective experiential factors into a quantifiable model that can power personalized route recommendations?
- Individual preferences for route factors vary significantly (some prioritize safety, others scenery)
- Street attributes can be mapped and quantified using available urban data
- A weighting system allows personalization while maintaining computational efficiency
- The model needs to be transparent so users understand why certain routes are recommended
- Simple binary filters (safe/unsafe, scenic/not scenic)
- Complex machine learning model with black box recommendations
- User-defined weighted scoring system
Developed 'Perceived Distance' as a transparent, weighted model where users can adjust importance of different factors. This balances personalization with user understanding and control.
Tested multiple weighting approaches, final framework uses normalized scores across 6 key factors with user-adjustable importance sliders.
Key decisions
Transparent weighted model vs. black box AI recommendations
Users needed to understand and trust why certain routes were suggested, especially for safety-related decisions
Higher user trust and adoption, users felt in control of their route preferences
Ideation & Design
Translated the framework and insights into tangible design concepts, focusing on user flows, information architecture, and initial screen layouts through wireframing.
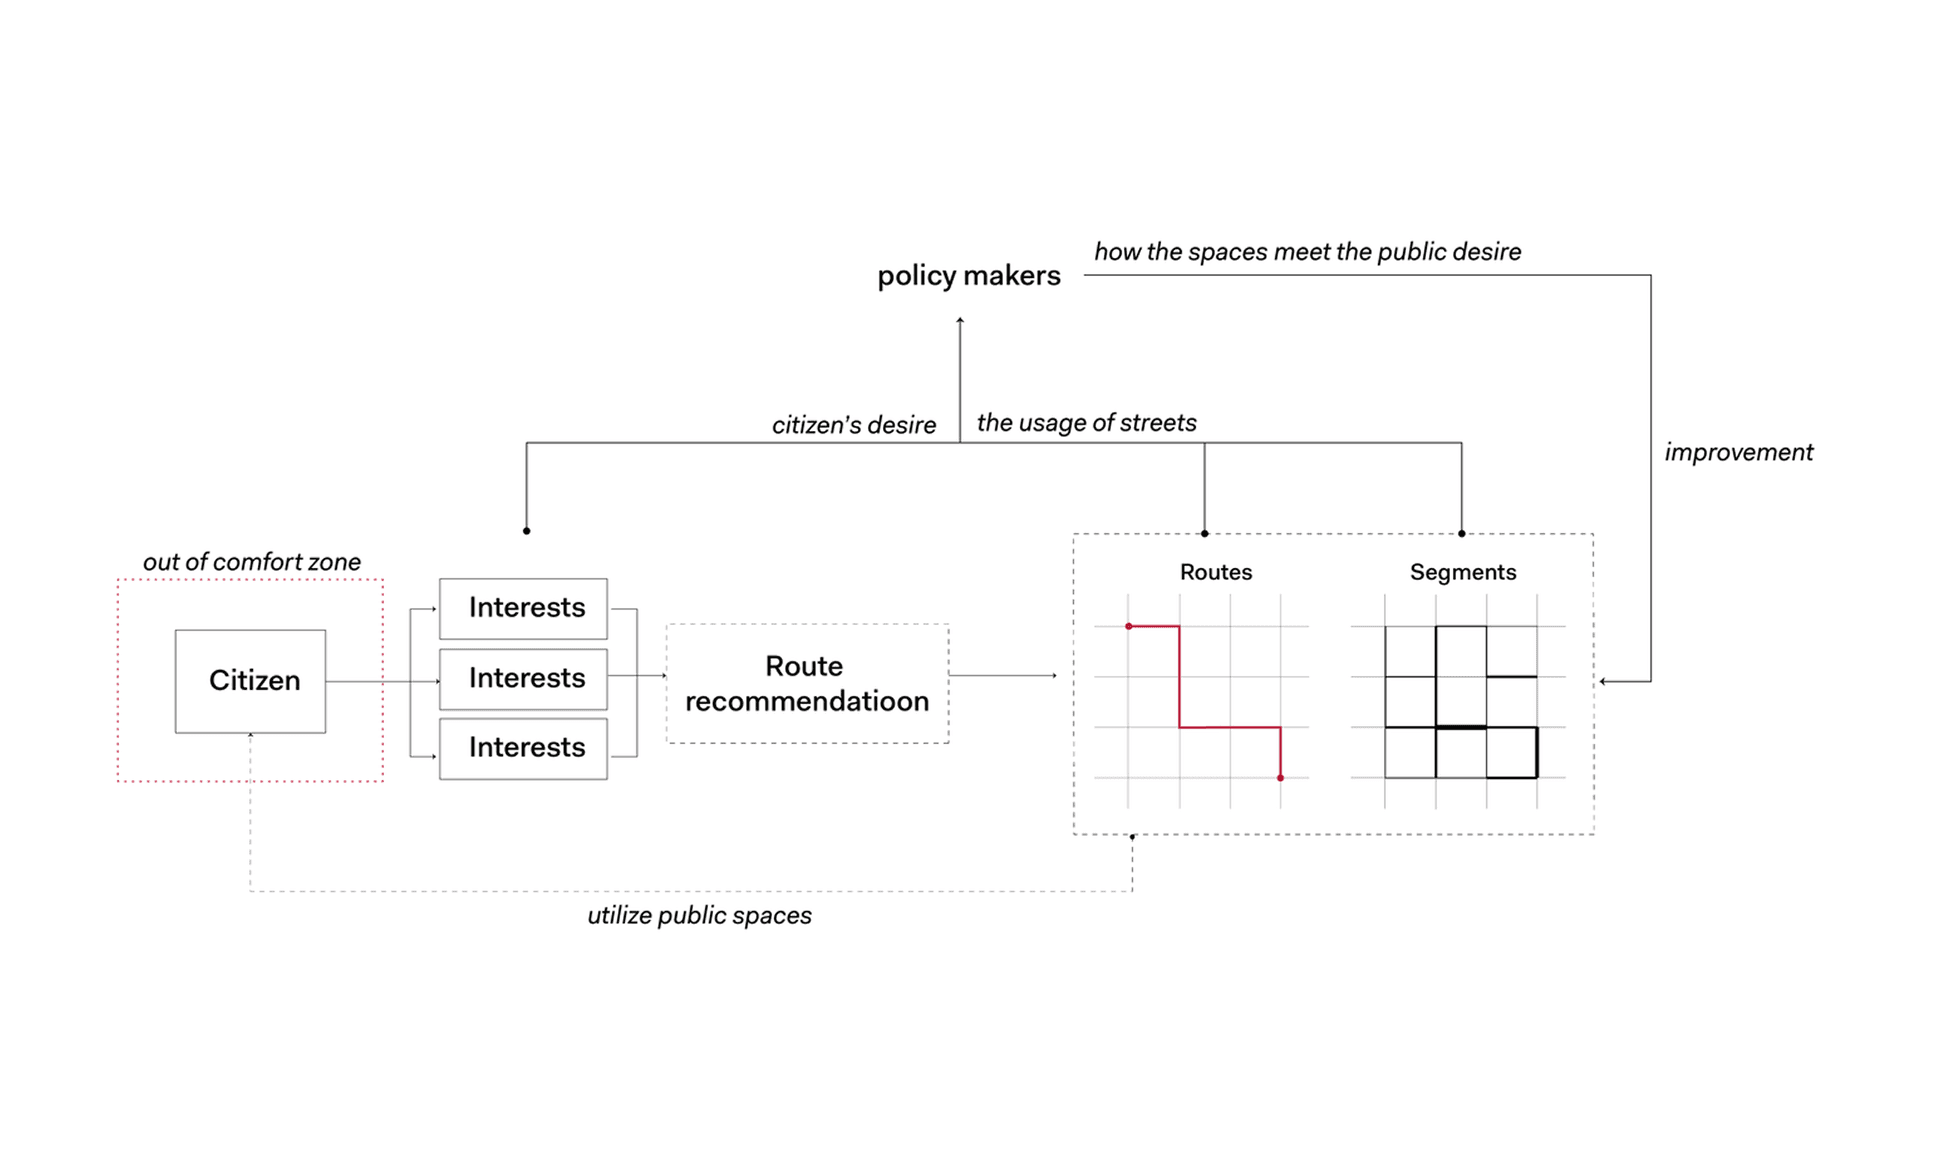
User Research
We conducted user research to understand their preferences and motivations for choosing routes. This provided valuable insights into the factors that influence their route choices.
Wireframing
Wireframes were created to explore how to effectively visualize qualitative route data and integrate it into a familiar navigation pattern.
UI & Prototyping
Developed the high-fidelity visual design and created an interactive prototype in Figma to simulate the core application experience for validation and feedback.
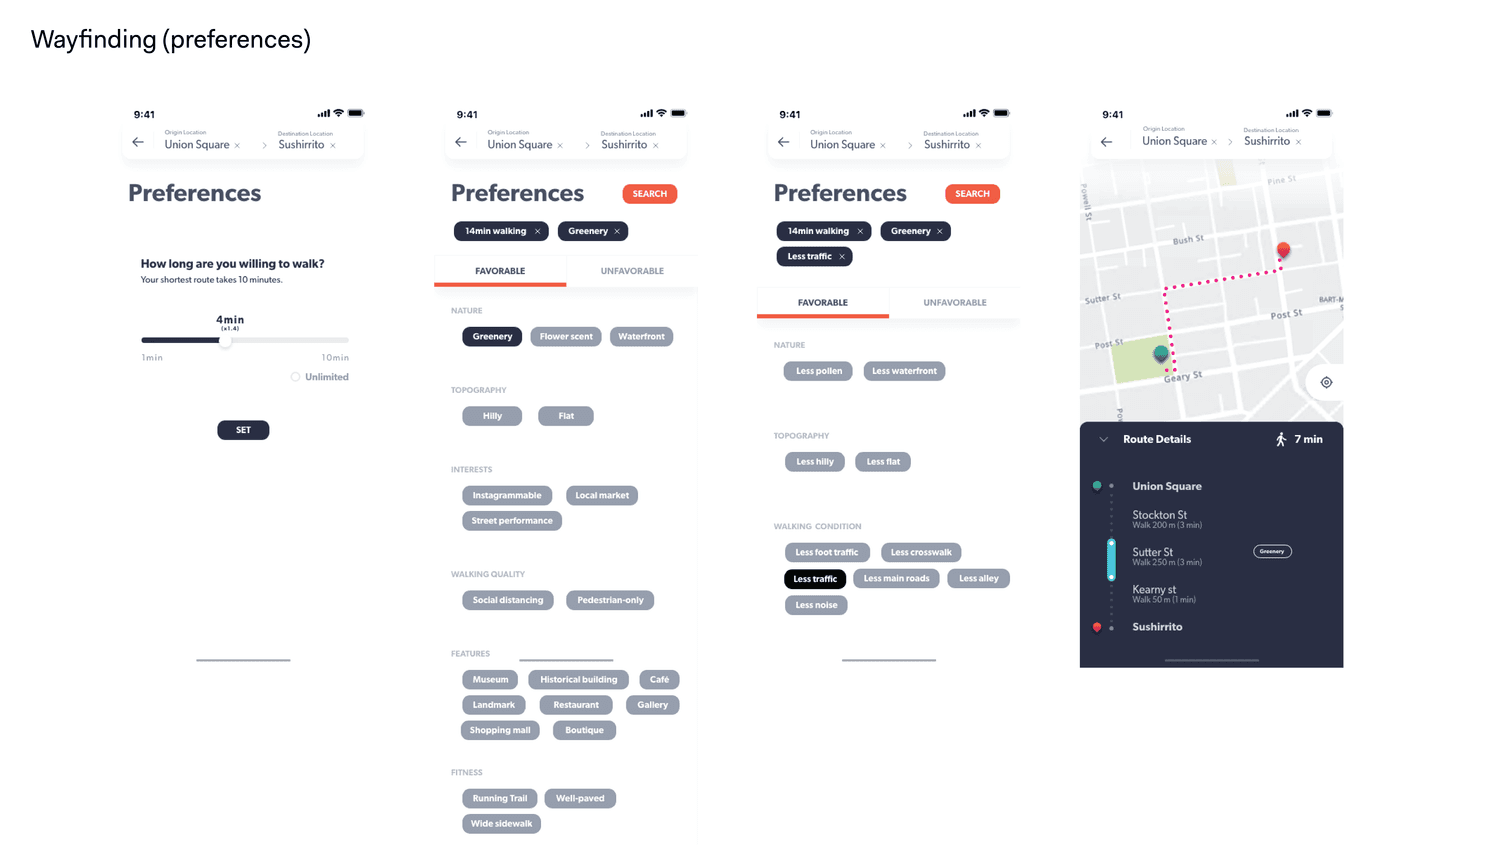
Prototype
The Figma prototype included key interactions for setting preferences, comparing routes with visual indicators, viewing route details, and starting navigation, allowing for realistic usability assessment.
Prototype link:
Shipped outcome
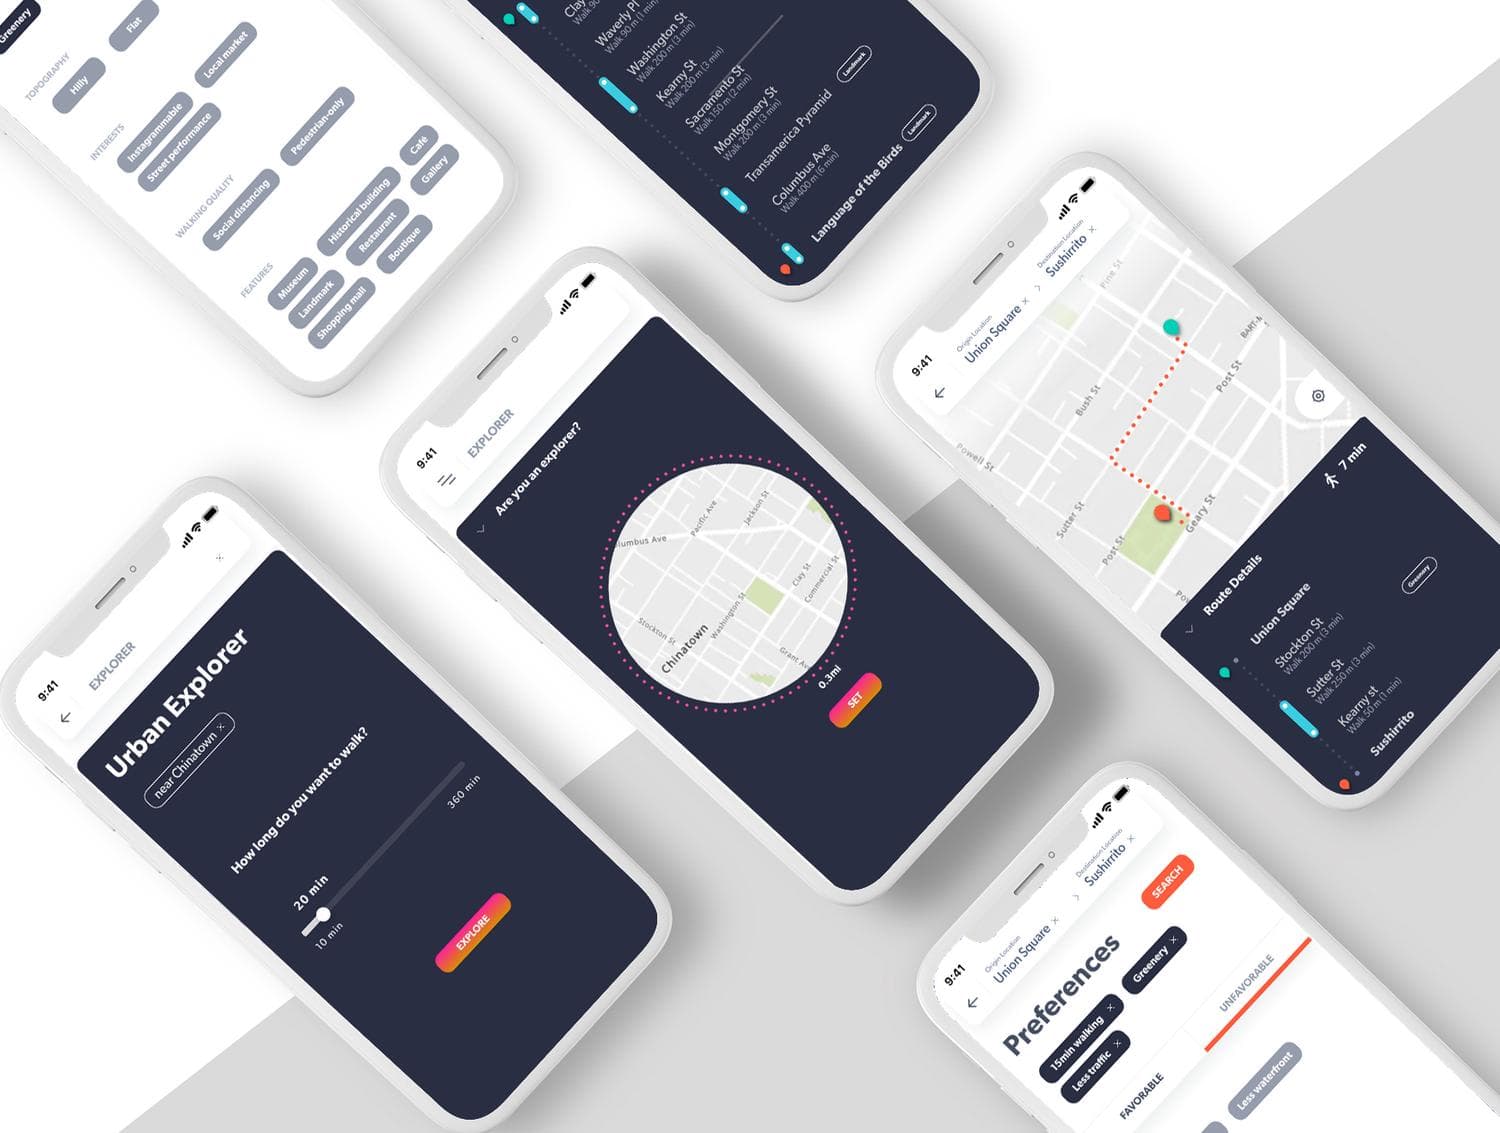

This project delivered both valuable research insights into pedestrian preferences and a compelling mobile app concept demonstrating how to design for journey quality. The prototype successfully visualized complex factors and validated user interest in more human-centered navigation, sparking interest in experience-driven routing tools.
Learnings
- Methodologies for translating qualitative research into quantifiable design inputs.
- Effective strategies for visualizing subjective or abstract data on mobile maps.
- Balancing innovative features with familiar navigation patterns for usability.
- The importance of user customization in perceived route quality.
Next steps
- Refine algorithms for calculating and weighting experiential factors.
- Conduct larger-scale user testing in real-world environments.
- Explore integration with diverse real-time urban data sources.
- Investigate potential accessibility features related to experiential routing.