Liminal Ghettos

Overview
- Role
- Data Visualization Specialist
- Period
- 2021
What I did
- Processed and analyzed big data to identify segregation patterns
- Designed and implemented data visualizations for public exhibition
Problem
Contemporary urban segregation often manifests in subtle, 'liminal' ways tied to movement and interaction, not just physical barriers. Understanding these invisible boundaries requires new methods beyond traditional analysis of static neighborhoods.
What I designed & built
Developed data visualizations portraying segregation as a dynamic social geography by analyzing geolocated social media activity alongside census/income data in Porto. Exhibited at the Porto Design Biennale, these visualizations aimed to make complex, fluid segregation patterns tangible and spark discussion on social cohesion.
Process
Data Processing
Processed big data for Porto, including geolocated social media, census records, contextualizing them with Porto's urban geography, particularly comparing before and after the COVID-19 period.
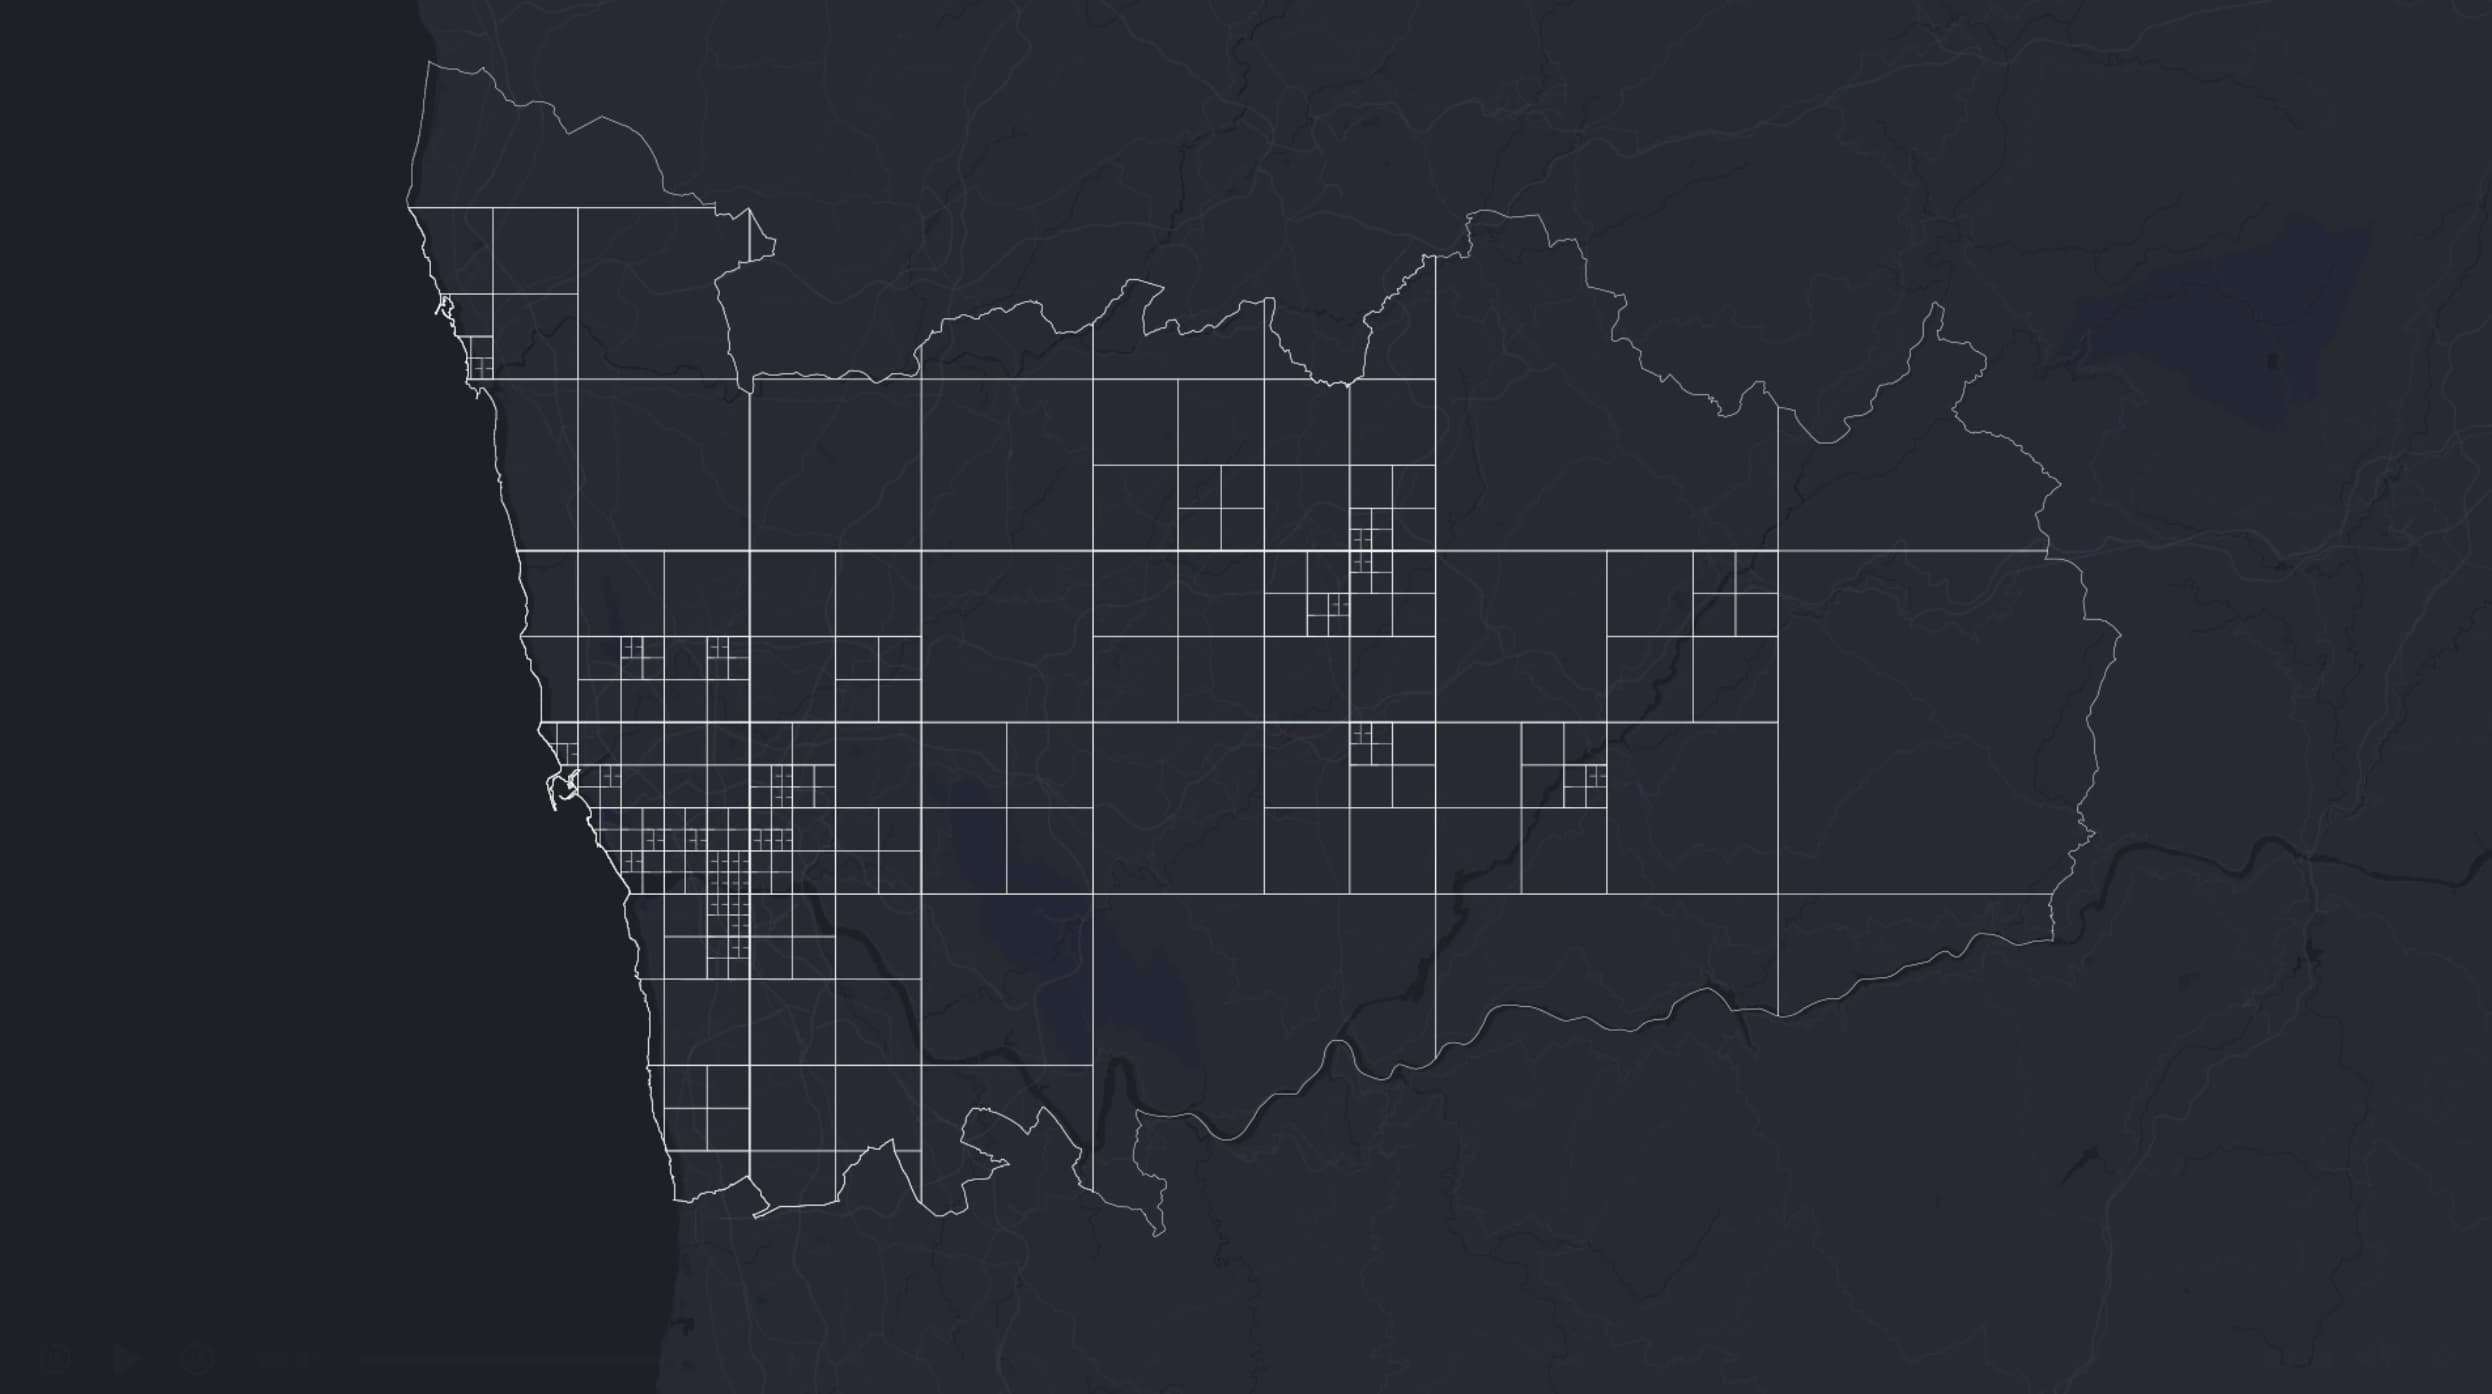
Identifying 'Liminal' Segregation Patterns
Analyzed movement flows and activity data between different neighborhoods and across socio-economic lines to identify and quantify patterns of 'liminal' segregation – segregation manifesting through choice and interaction, not just physical division.
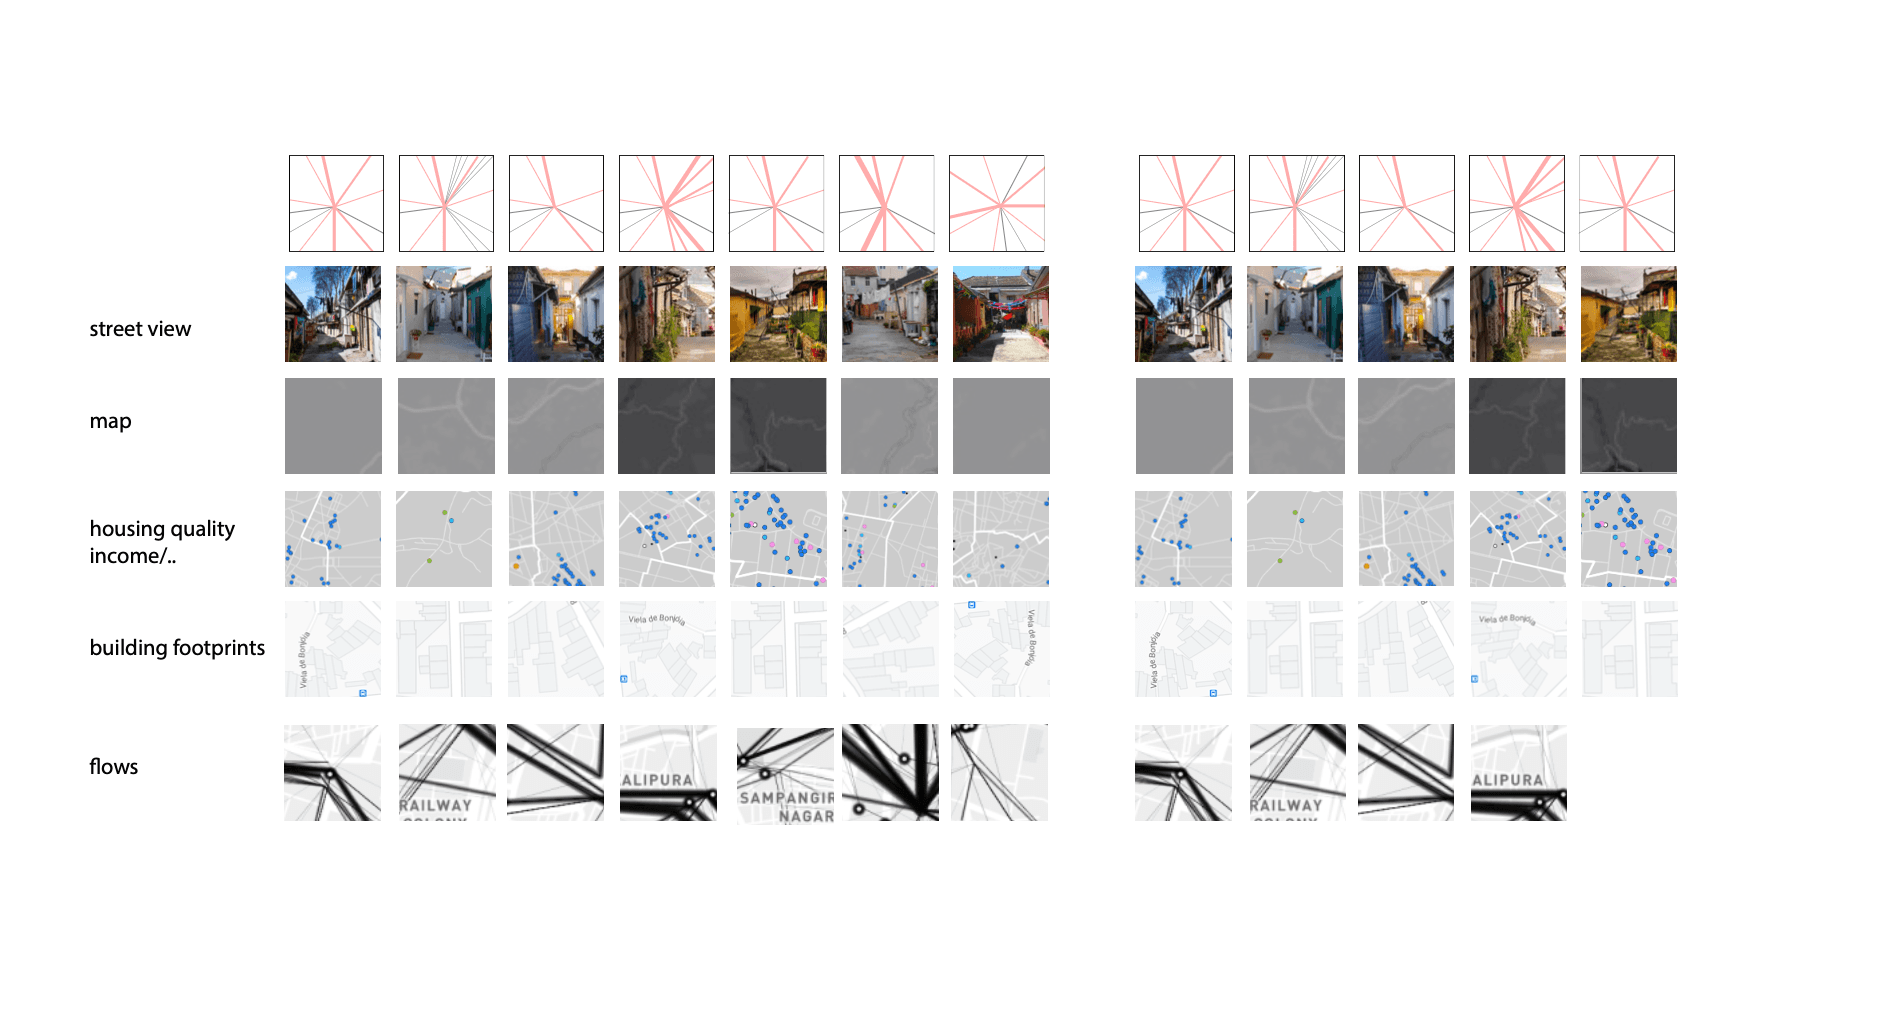
Visualization Design for Exhibition
Designed and developed compelling visual narratives to communicate the complex findings about segregation patterns effectively to a broad public audience at the Porto Design Biennale.
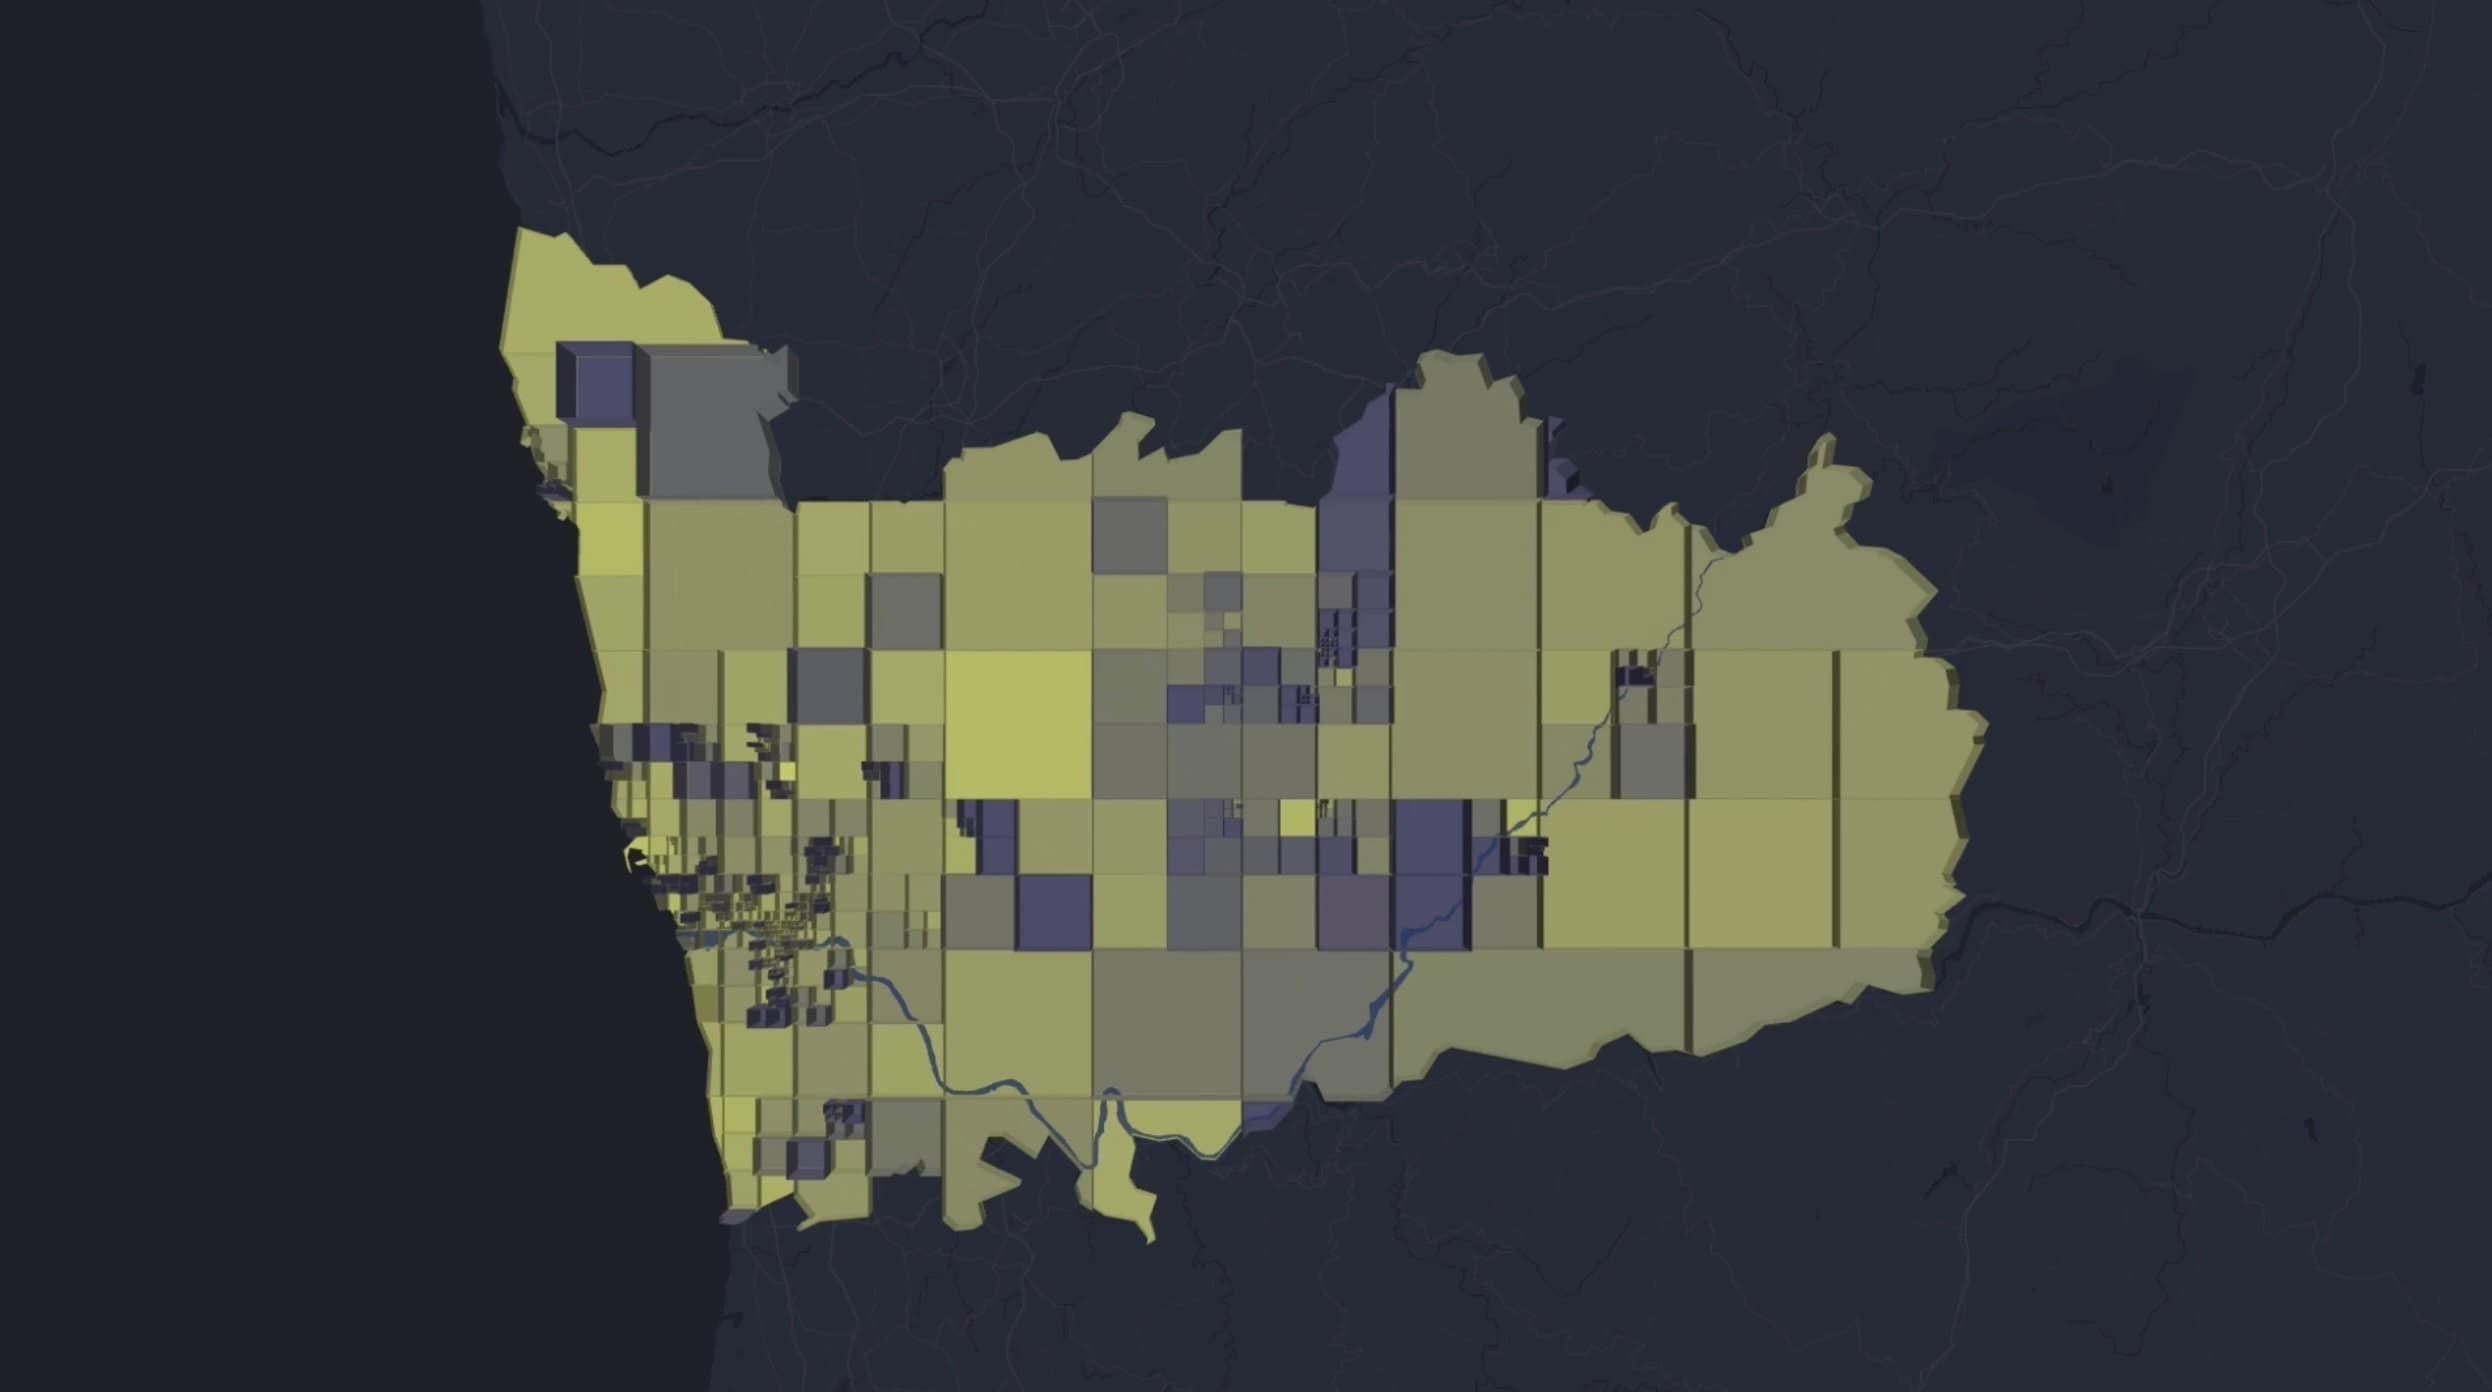
Shipped outcome
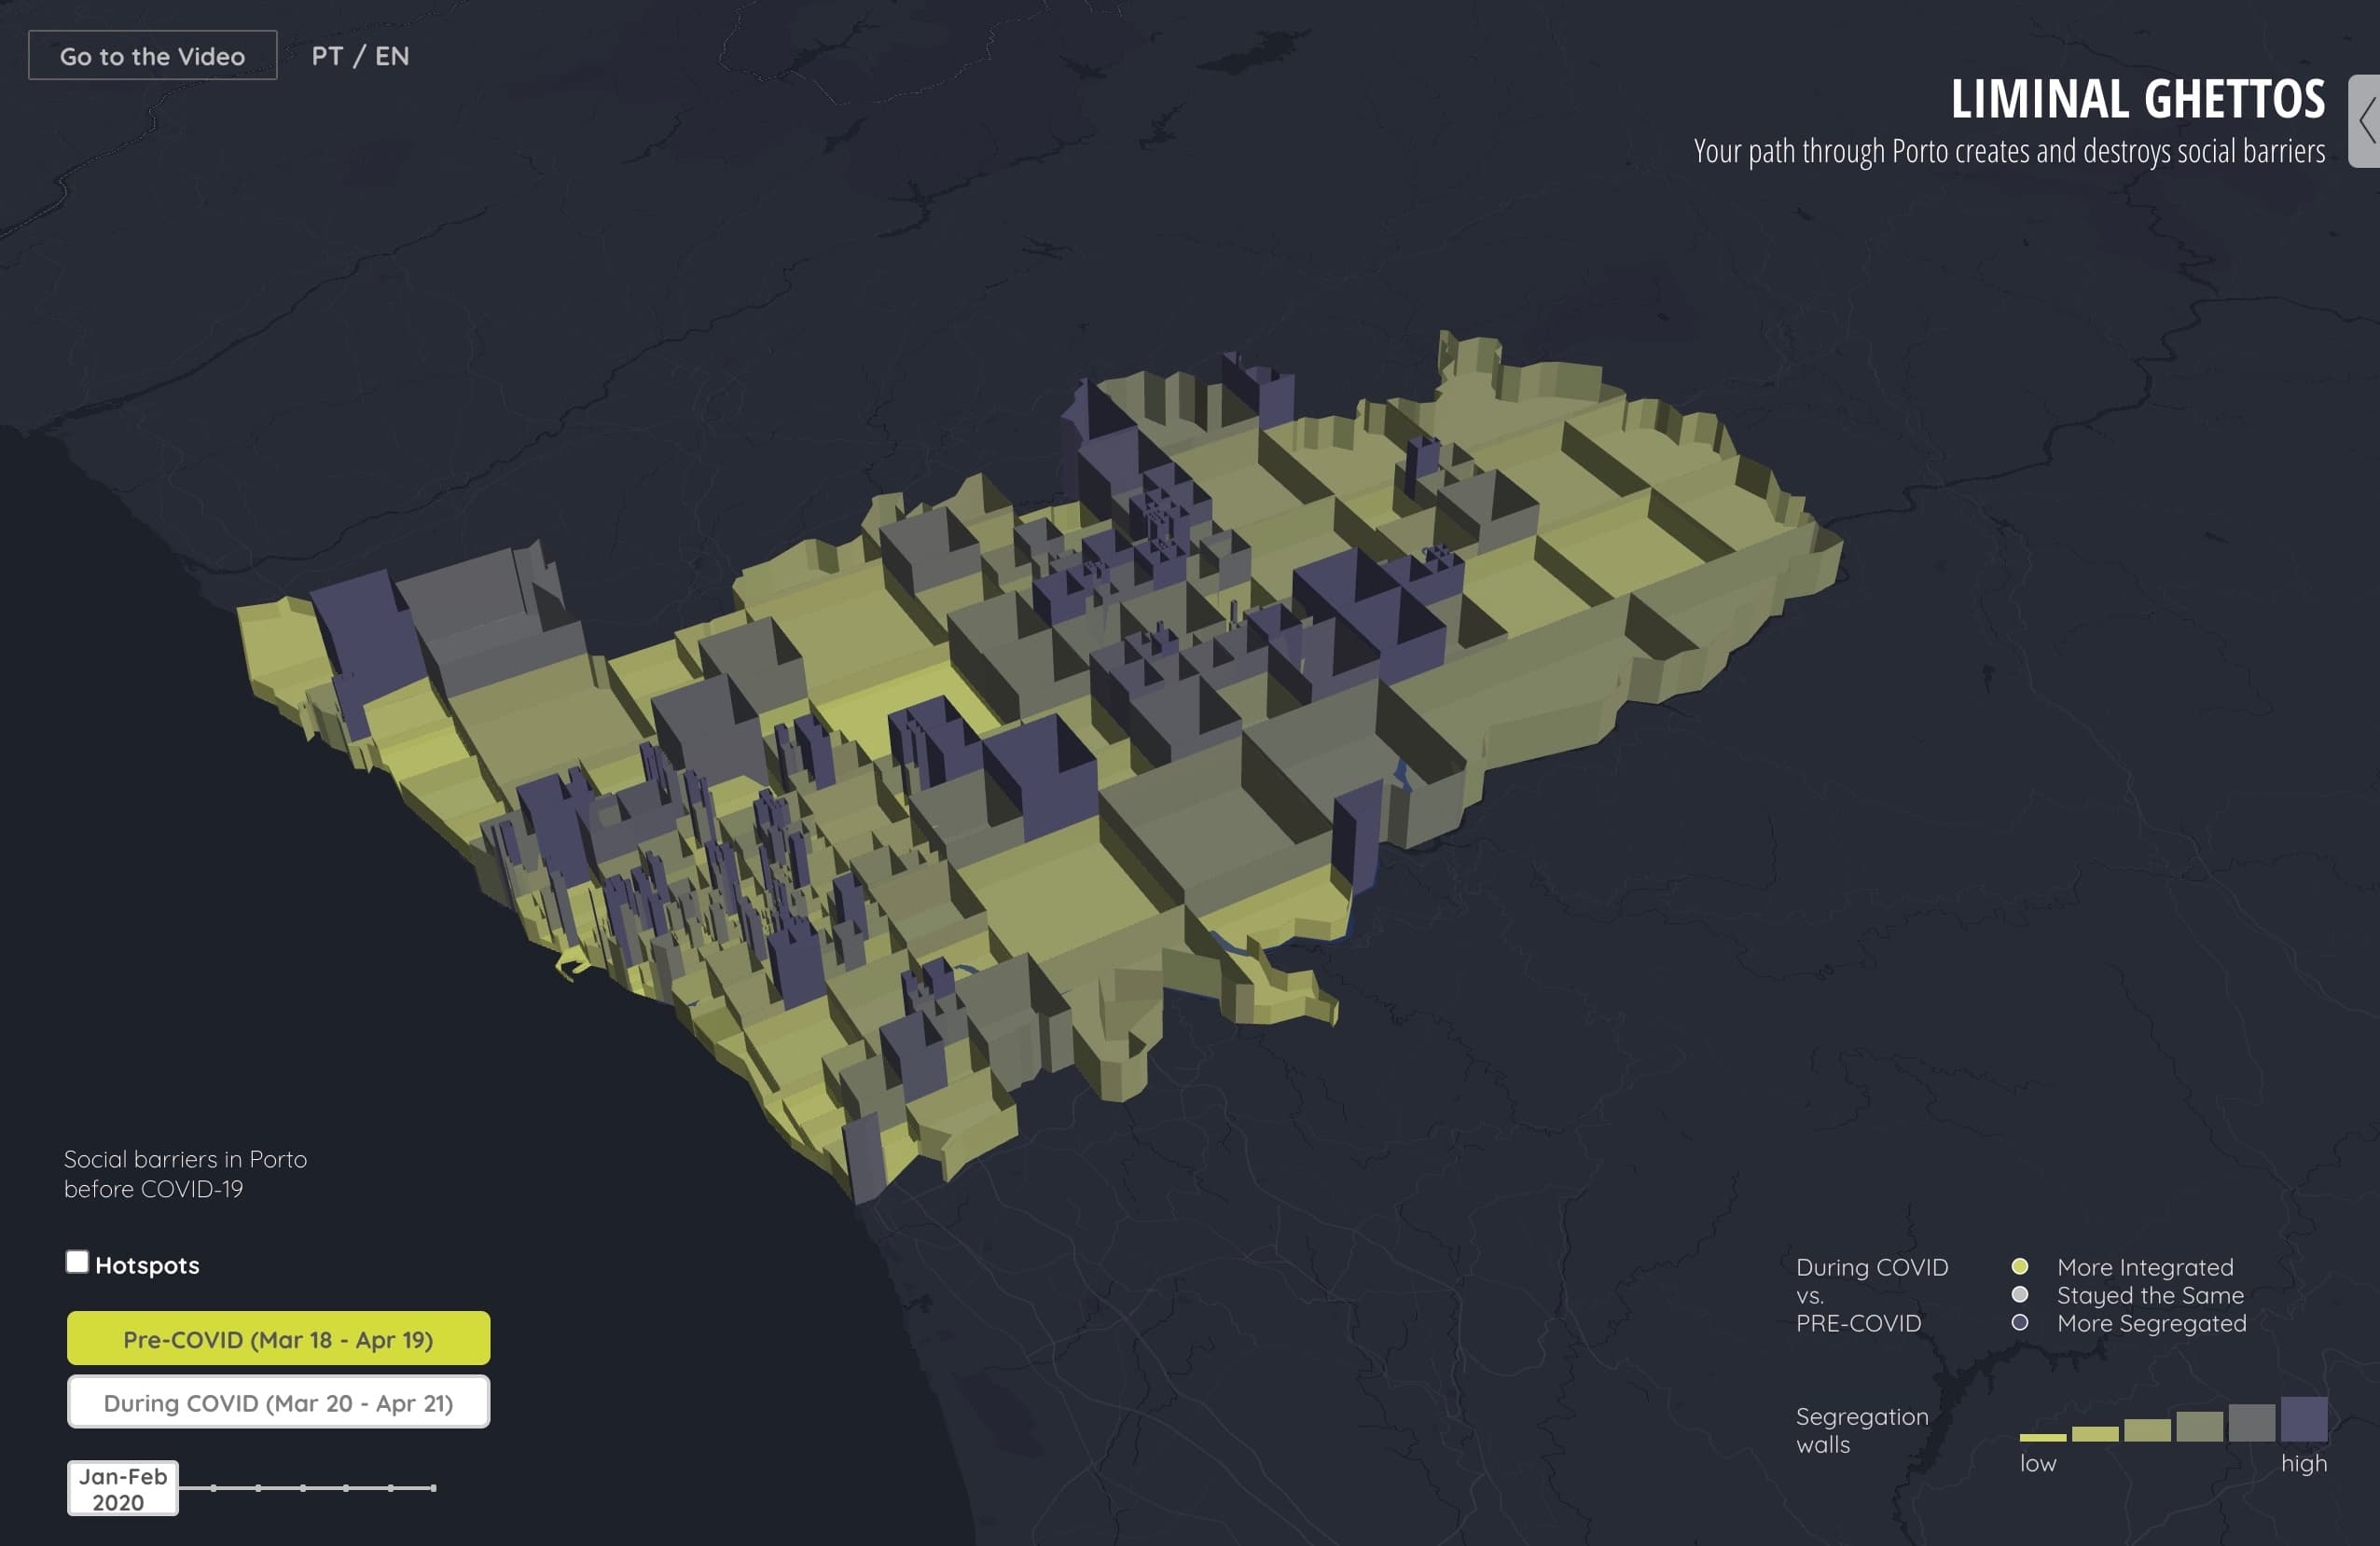
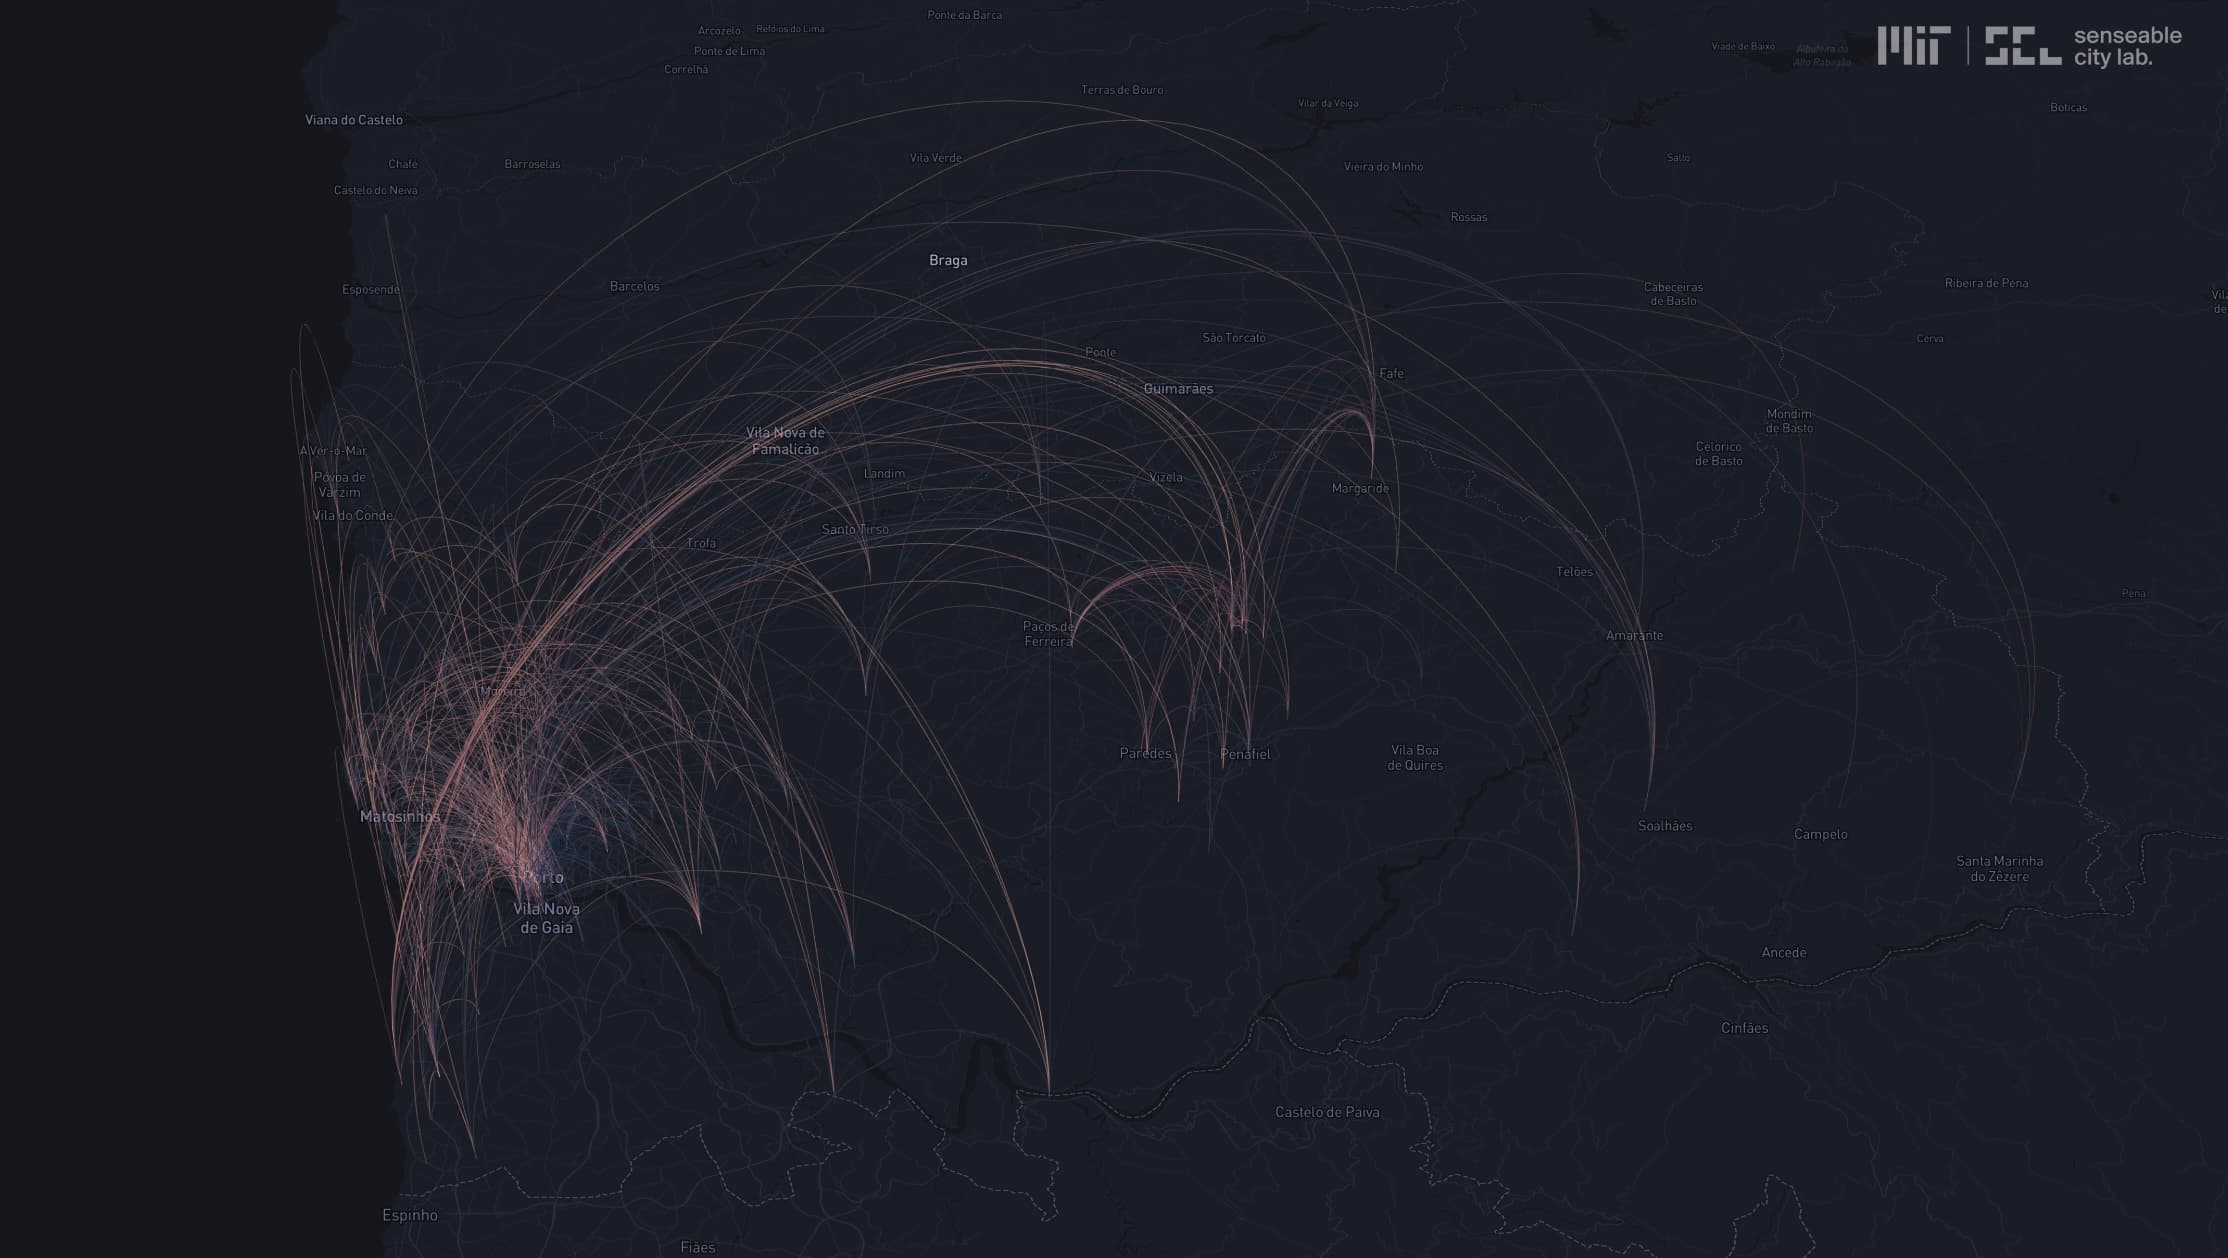
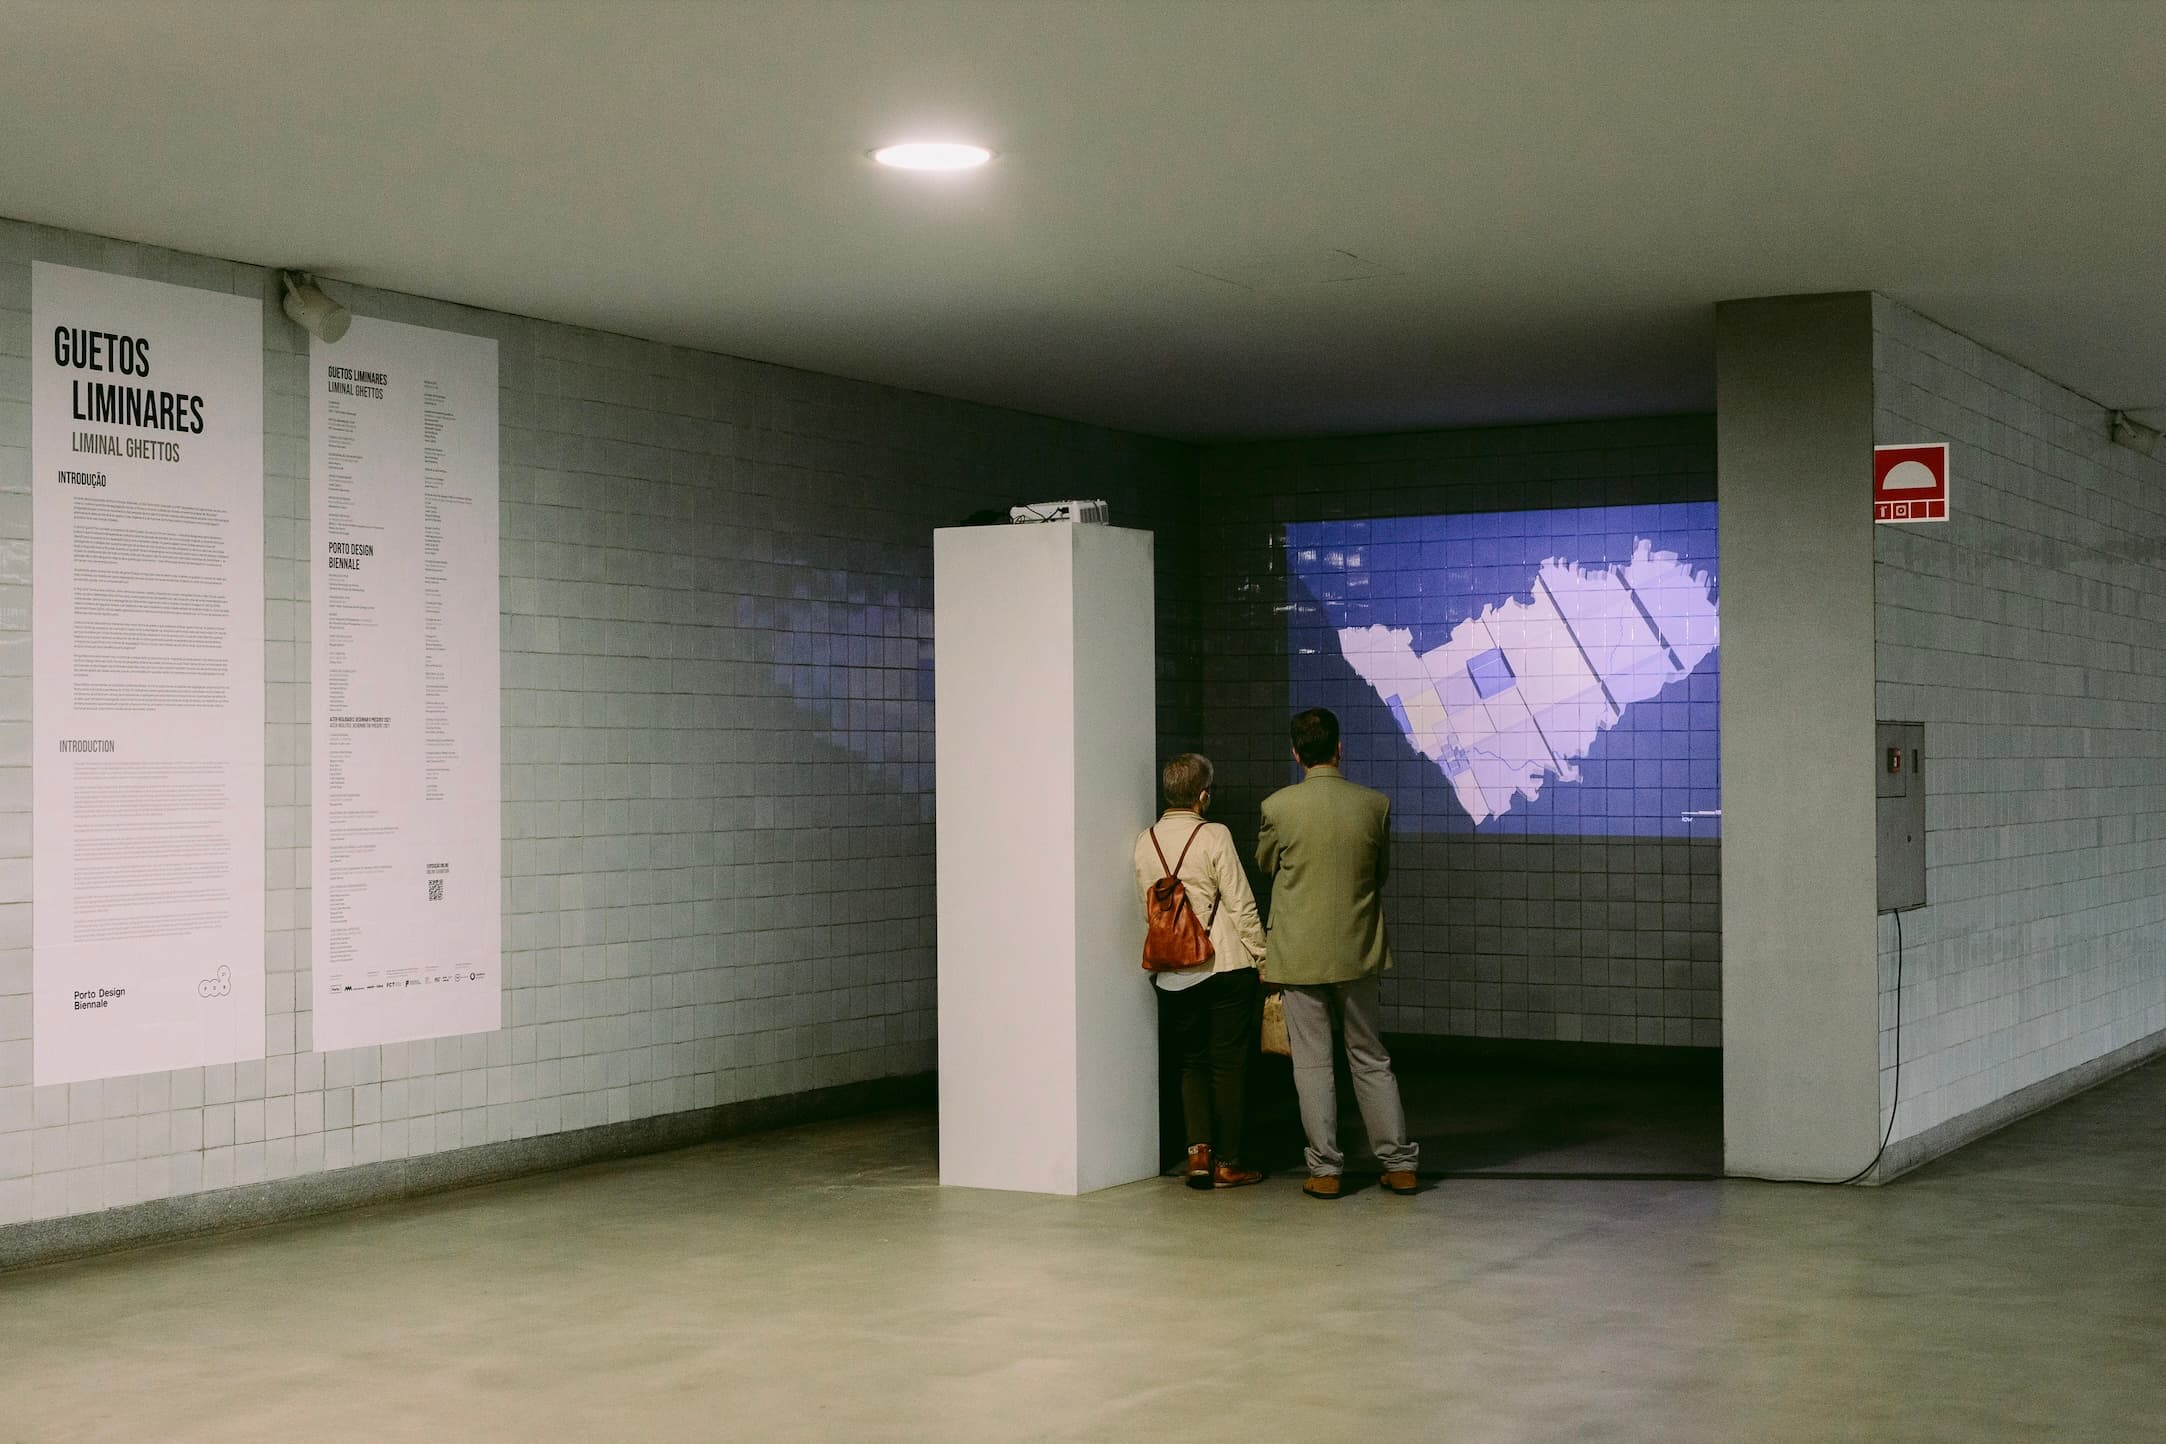
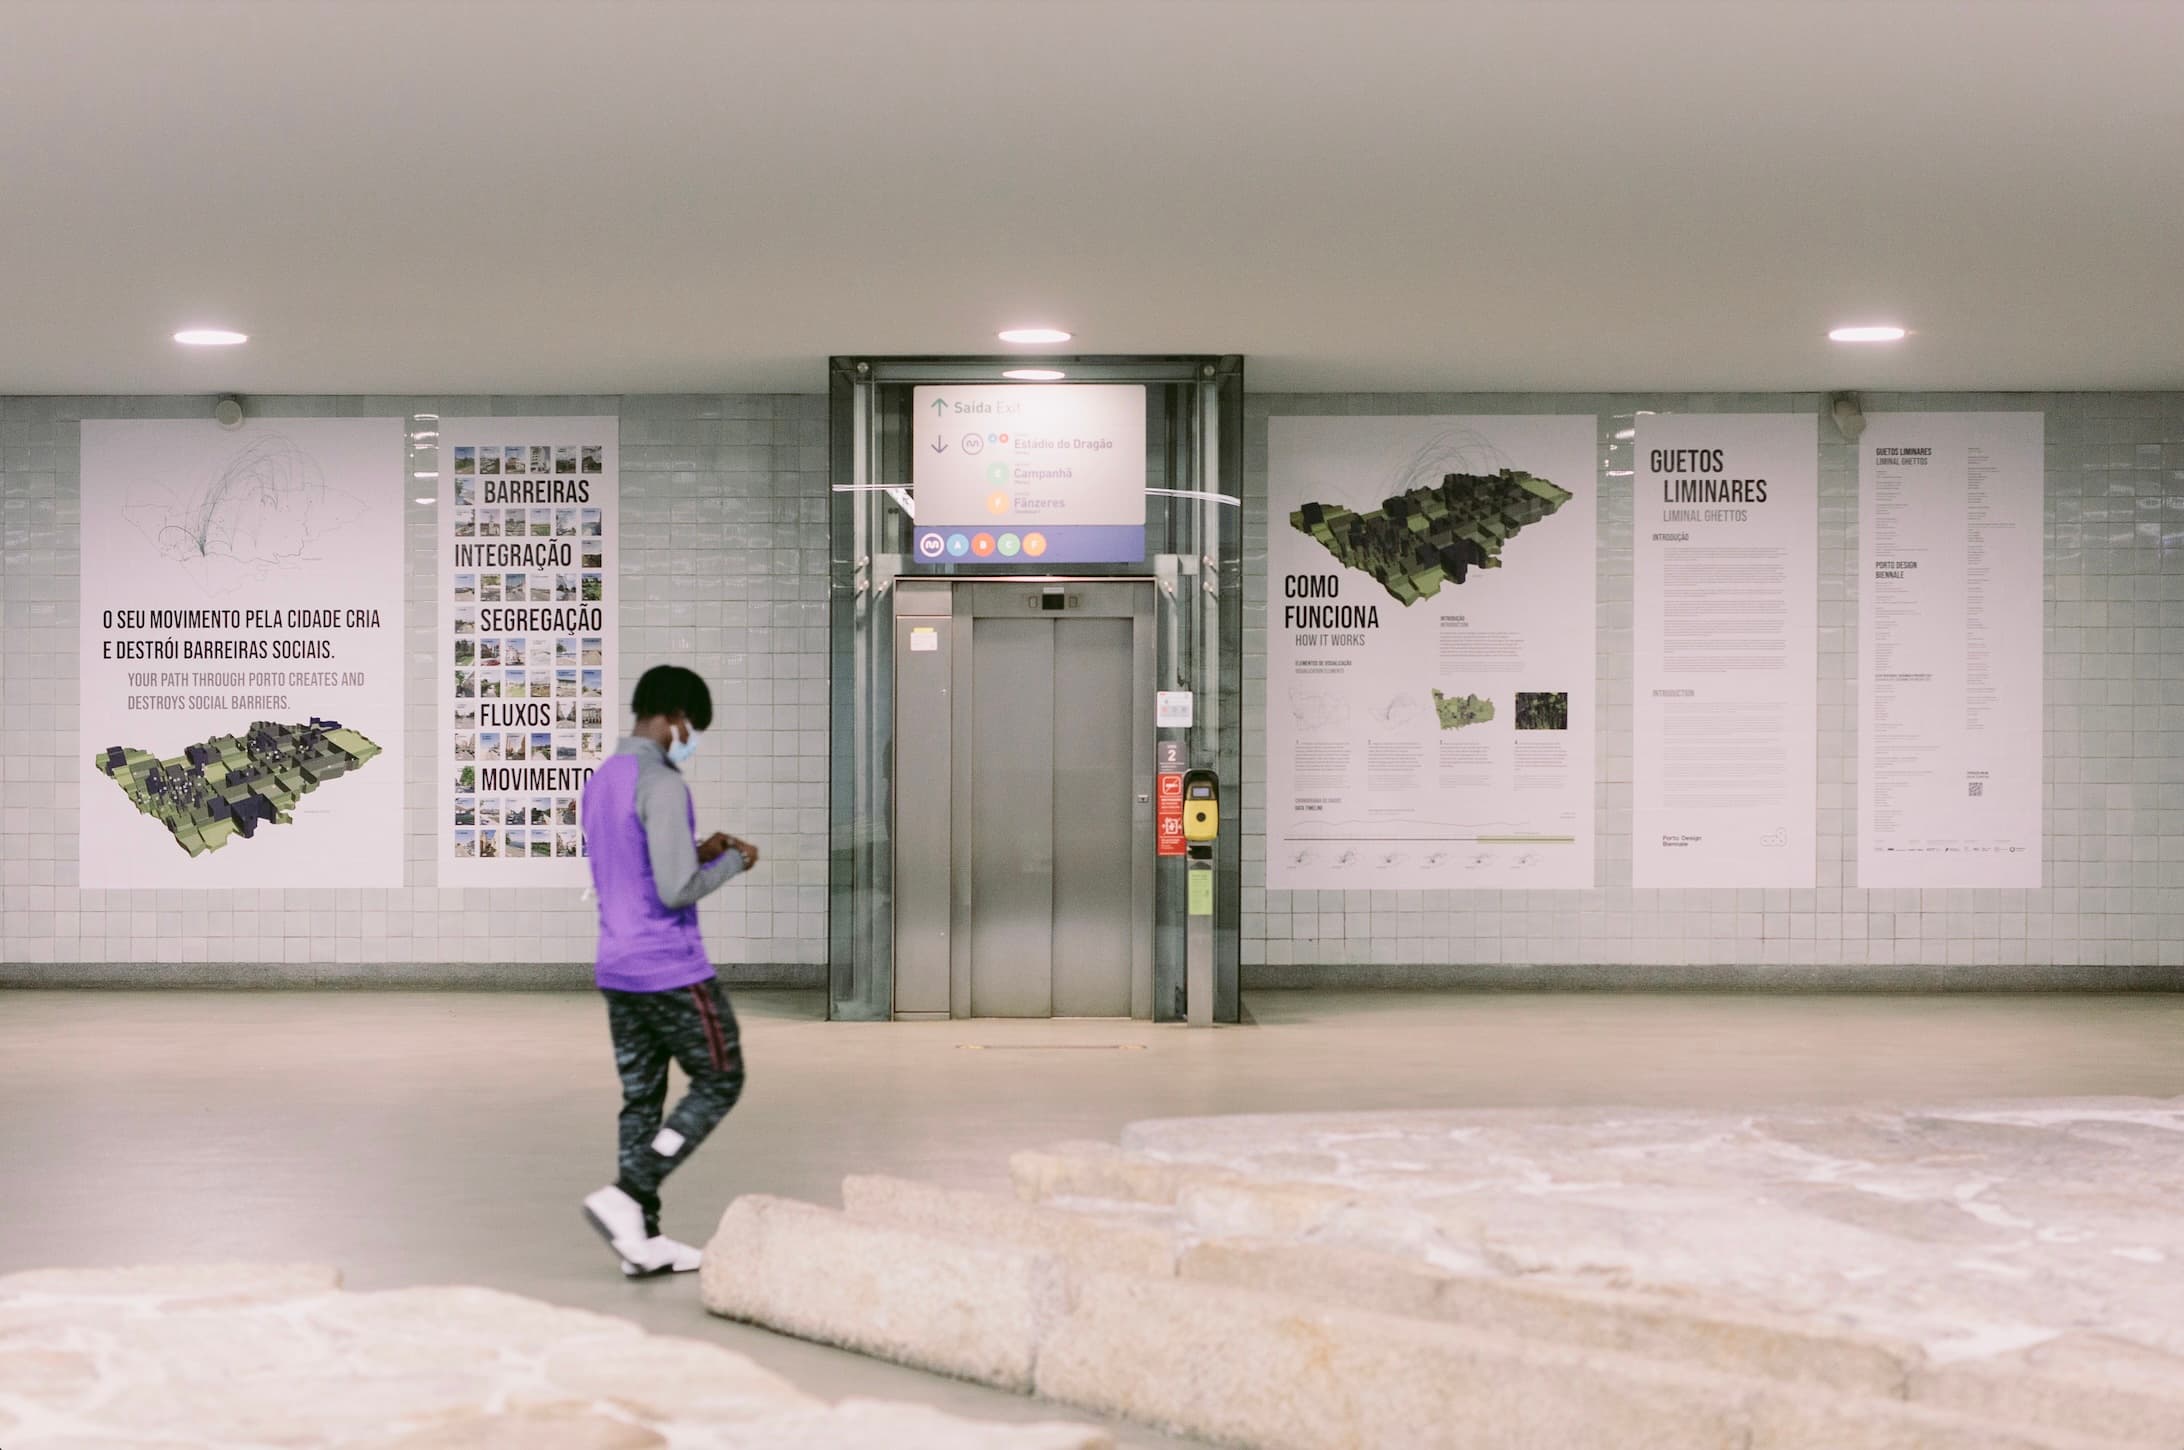
The visualizations provided a new lens on contemporary social segregation, revealing subtle, data-driven patterns within Porto during Covid-19. Exhibited prominently at the Porto Design Biennale 2021, the work contributed to public and academic discourse on urban inequality and the potential of Big Data to illuminate complex social dynamics.
Learnings
- Applying GIS and Big Data analysis to reveal subtle or complex urban patterns
- Designing effective visualizations to communicate complex, multi-layered research findings clearly
- Translating complex spatial GIS analysis into accessible and impactful data visualizations