SQ9: Activating Public Spaces

Overview
- Role
- Researcher / Designer / Data visualization
- Period
- Fall 2019
What I did
- Contributed to the project concept development
- Designed and developed data visualizations
- Participated in sensor data interpretation and analysis
Problem
The entrance plaza of MIT's Department of Urban Studies and Planning (Building 9) was significantly underutilized, lacking the engagement and activity expected of a central public space on campus.
What I designed & built
We organized a tactical urbanism event using movable furniture and plants to activate the plaza. We simultaneously deployed Bluetooth beacons and WiFi sensors to anonymously track furniture usage and pedestrian presence, generating quantitative data to measure the impact of the interventions on space activation.
Process
Plaza Intervention Design
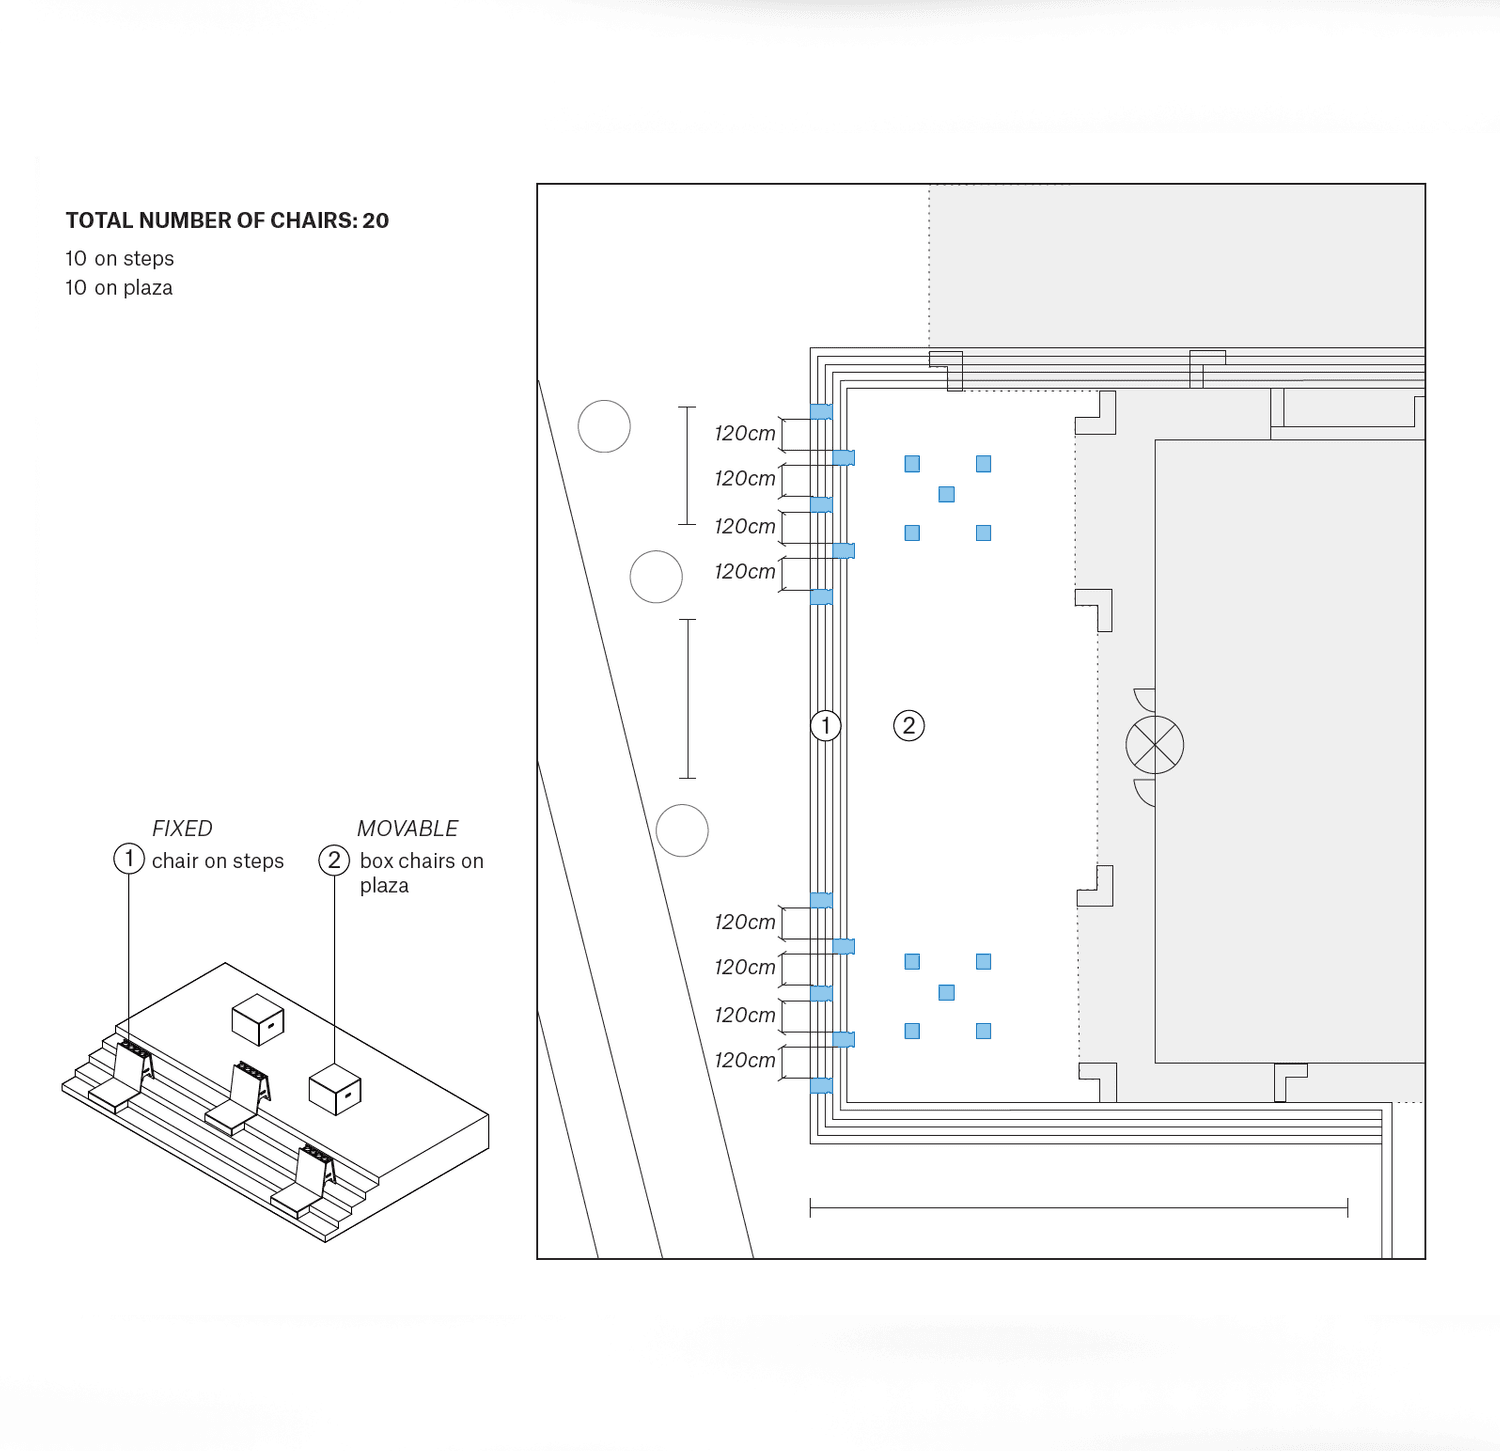
Developed a tactical urbanism plan including movable box chairs designed to hold Bluetooth beacons, aiming to encourage flexible use of the @SQ9 plaza during a dedicated event.
Sensor Setup & Data Collection Strategy
Deployed Bluetooth beacons inside chairs and WiFi sensors around the plaza. Established a system using triangulation to anonymously estimate device locations (representing people and furniture) on a shared coordinate system.
We did not collect personal information; all data were aggregated and not personally identifiable.
Technical Details:
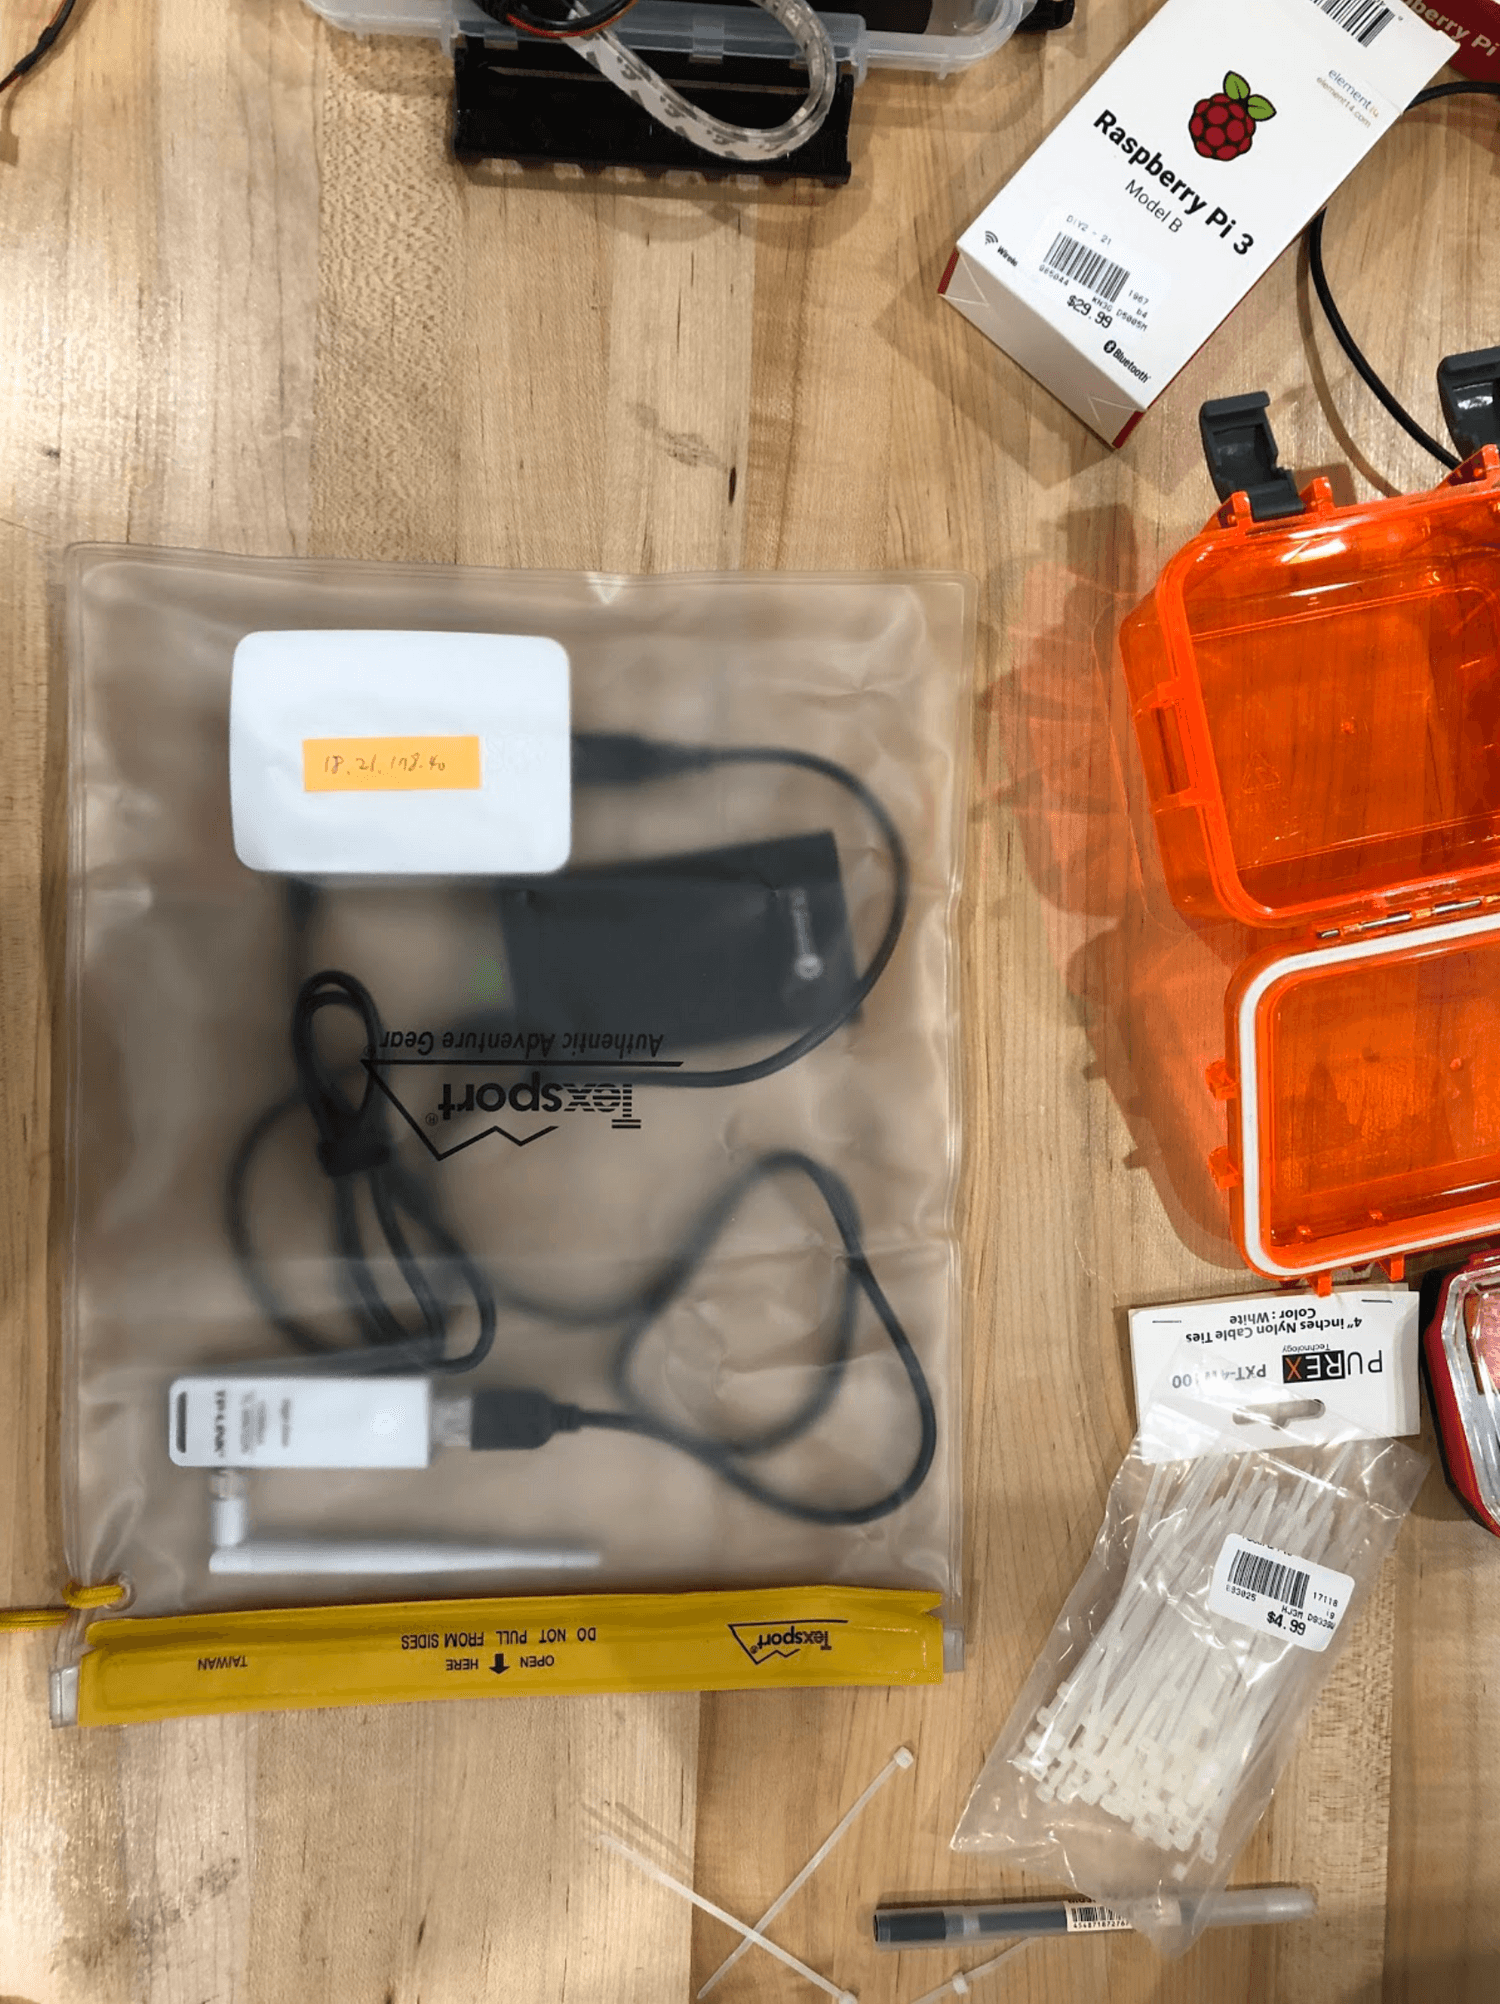
- We used Raspberry Pi devices configured as WiFi sniffers to detect MAC addresses (anonymized through one-way hashing)
- Estimote beacons were embedded in the furniture pieces
- A custom triangulation algorithm developed in Python processed signal strength data from multiple sensors to approximate positions
- Data was processed in real-time with a 30-second refresh interval
- The entire system operated on a local network to ensure privacy and data security
Data Visualization (Web & Real-Time)
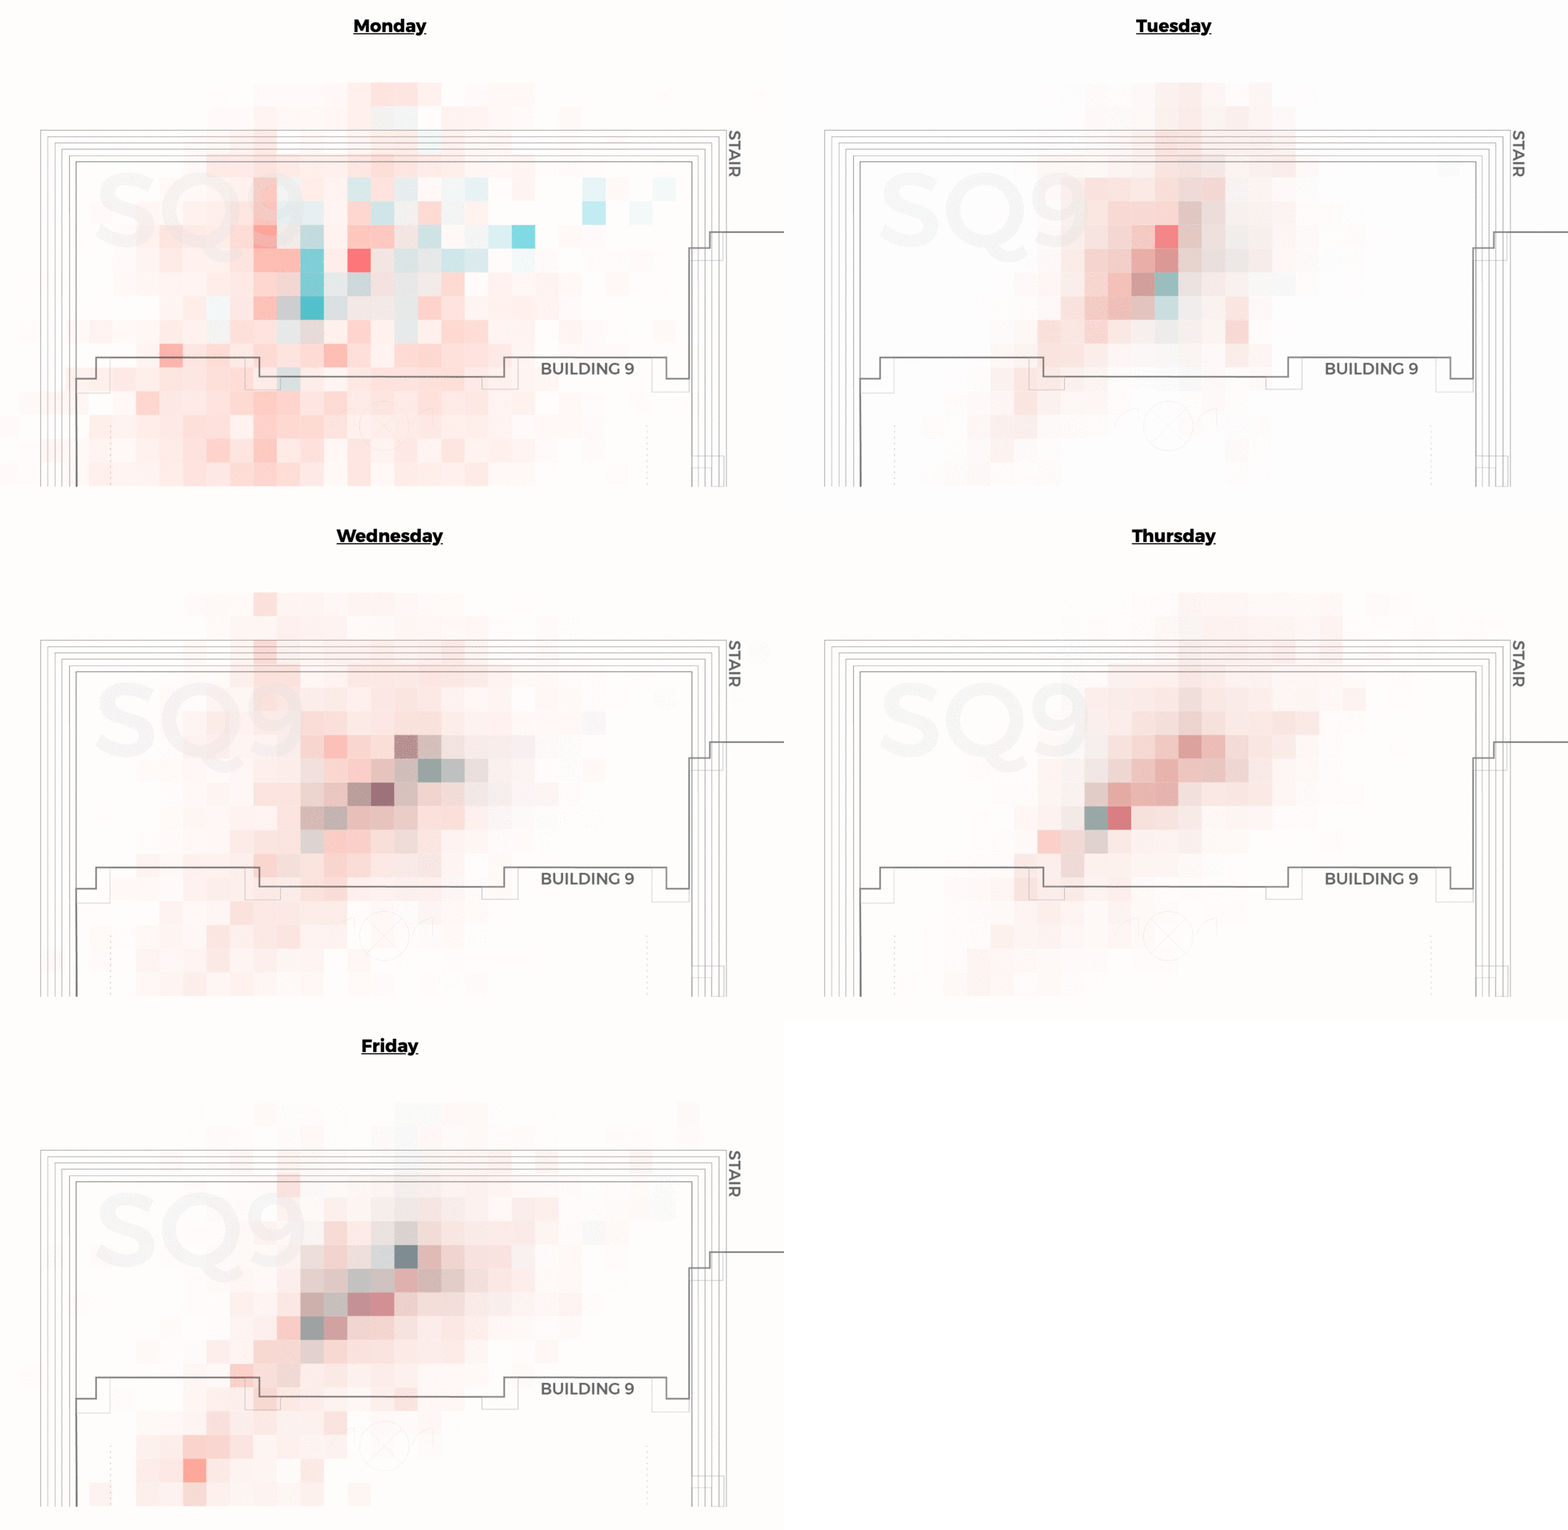
Analyzed sensor data to understand activity patterns. Designed and developed two distinct visualizations using Vega-lite and JavaScript: an analytical web interface for exploring day-to-day patterns, and a real-time display projected in the building lobby during the event.
Visualization Implementation:
- The web interface was built to allow for dynamic filtering of time periods
- We created custom heatmap visualizations to represent dwell time and movement patterns
- The real-time display received live data updates without requiring page refreshes
- We employed color gradients to represent different levels of activity intensity
- A custom animation system showed the 'flow' of movement between different areas of the plaza
Event Execution & Live Display
Ran the tactical urbanism event, observing interactions with the furniture and space. The real-time visualization provided immediate feedback on plaza activity levels to building occupants and event participants.

Shipped outcome
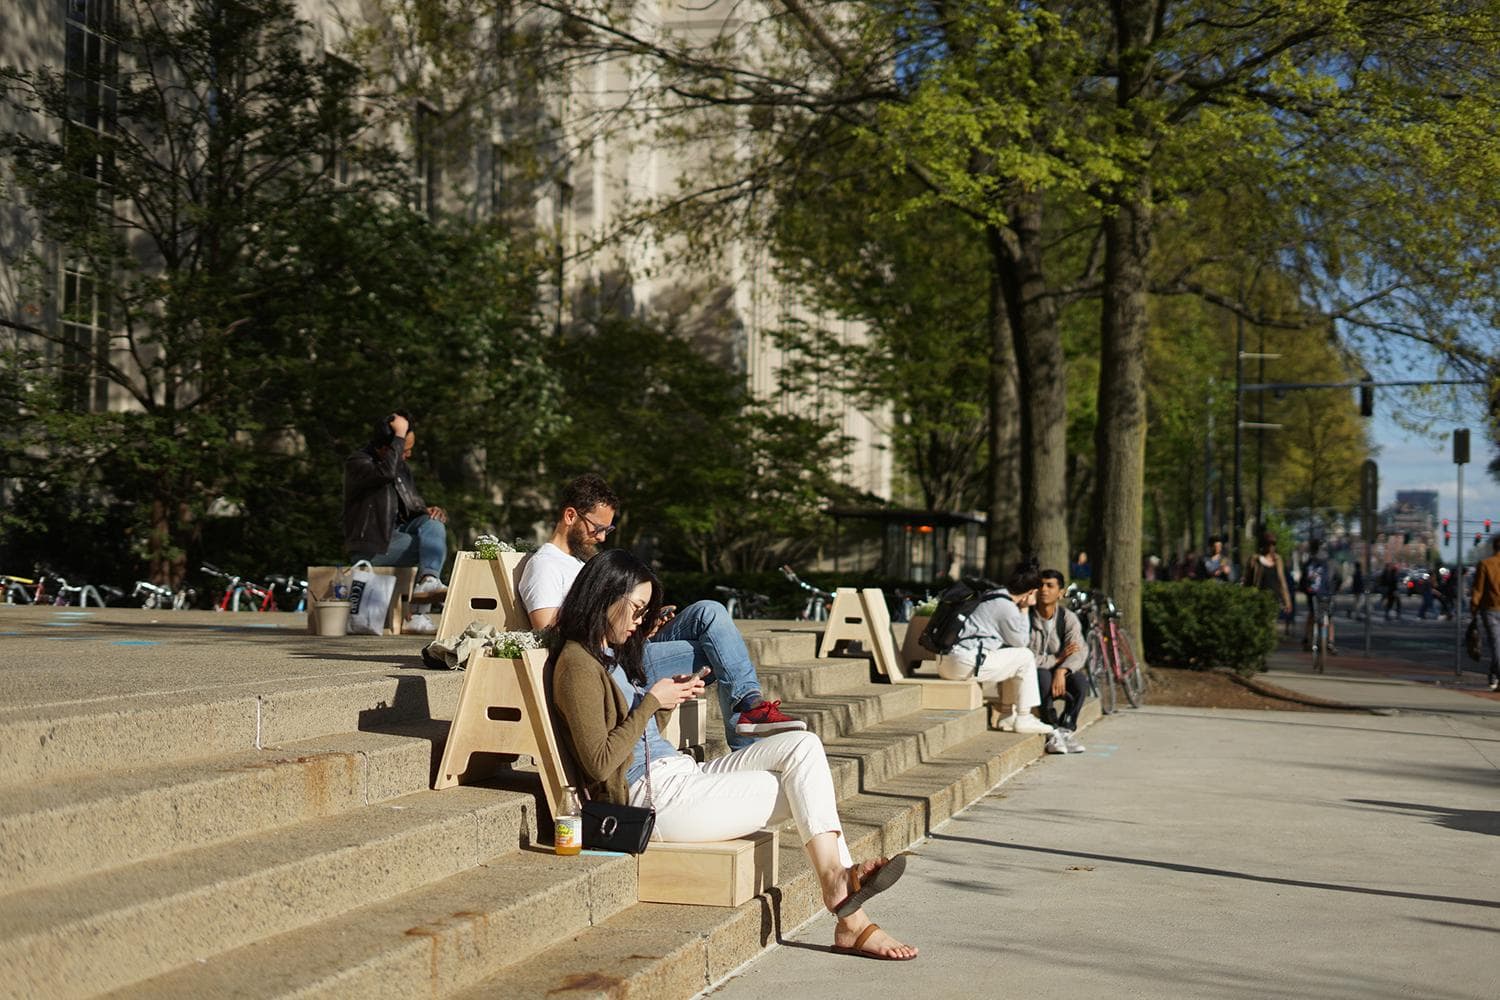
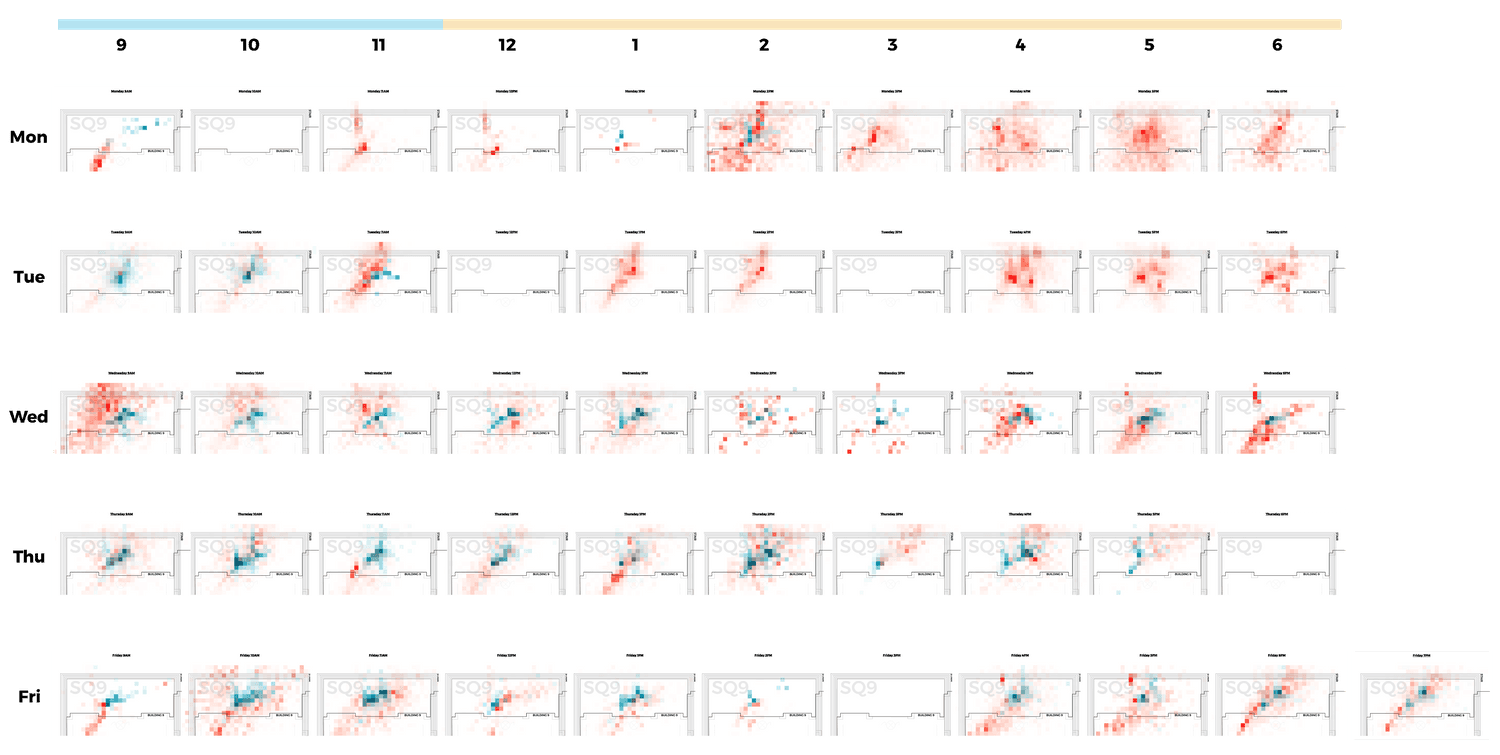
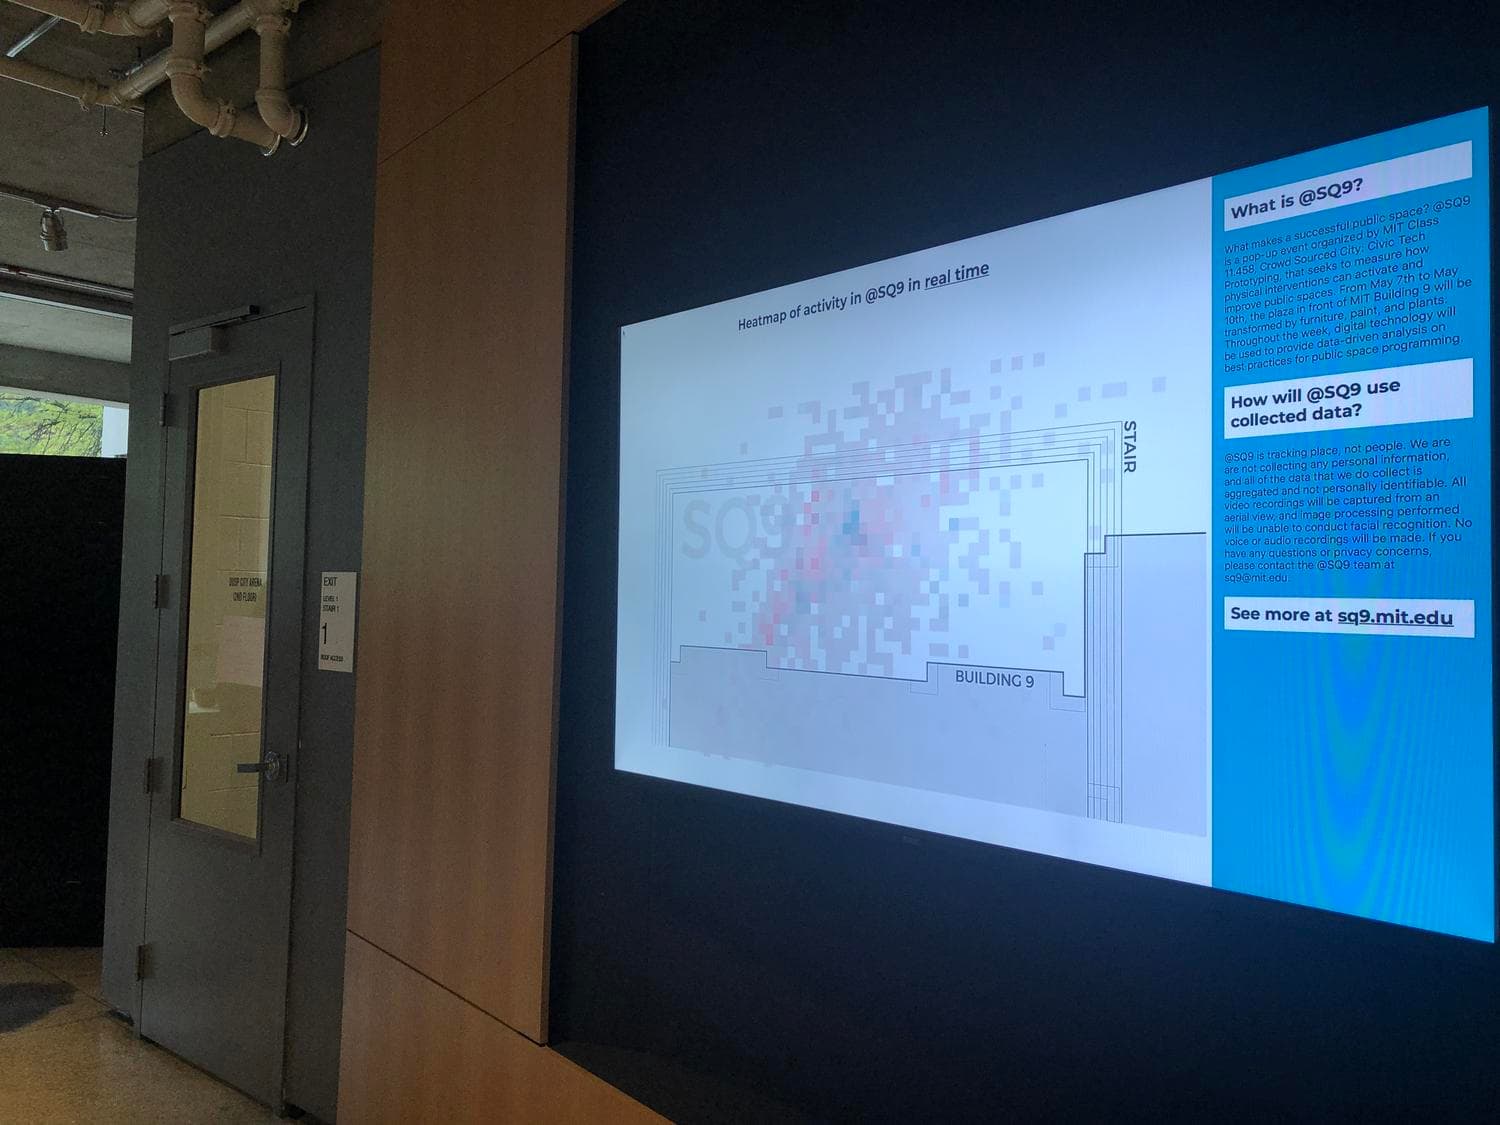
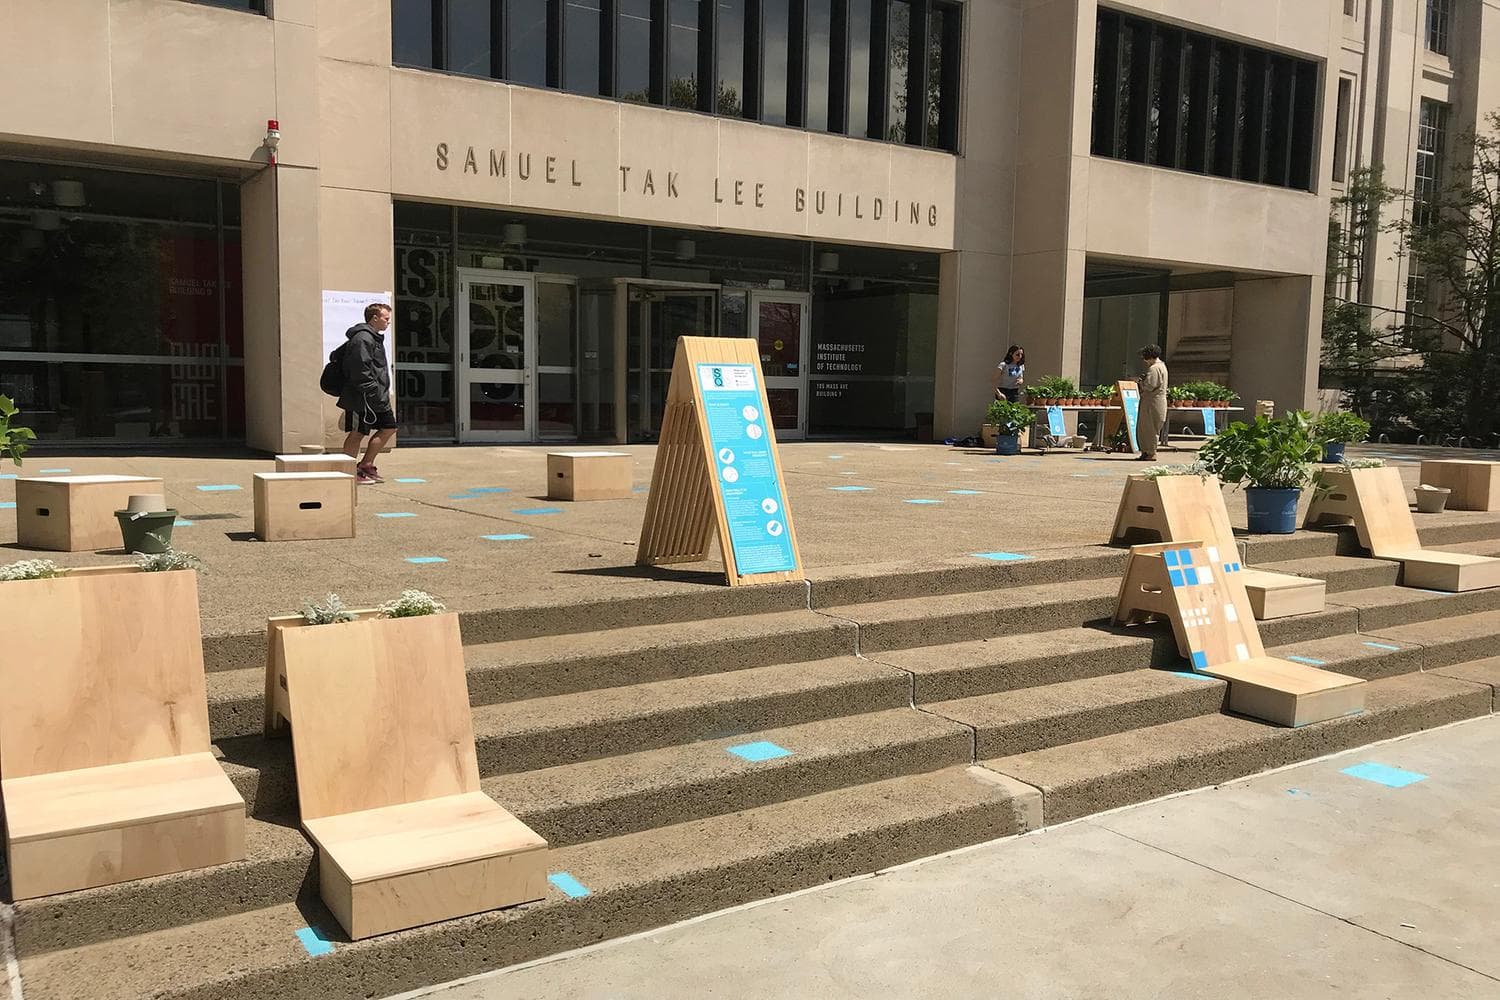
The project successfully demonstrated how low-cost tactical urbanism combined with accessible sensing technology can both activate a public space and provide quantitative evidence of the intervention's impact. The visualizations made activity patterns tangible, informing future considerations for the plaza's permanent design and showcasing data-driven methods for public space evaluation.
Learnings
- Applying tactical urbanism principles for rapid, temporary public space activation.
- Utilizing IoT sensors (Bluetooth, WiFi sniffing) for anonymous activity monitoring in public spaces.
- Creating interactive web-based data visualizations.